More scale-stack bar charts
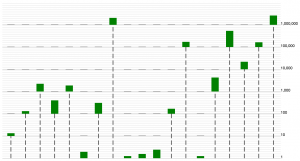
It seems that Jan beat me to it but to learn Paper.js and JavaScript I was also working on an implementation of the scale-stack bar charts. I took some of his code because this makes it easier to follow between the posts. What I added or changed in order to get to know Paper.js is:
- Added a legend to the right of the graph that shows the numbers with a thousands separator
- The graph layout is adjusted depending on the screen size
- The size of the vertical lines and bars is dependent on the total size of the graph
- Added small division lines
- Used different colors and styles for the lines and bars
These are just some minor tweaks but there were helpful in learning how to do things in Paper.js.
var horizontalMargin = 20;
var barMargin = 40
var horizontalOffset = horizontalMargin + barMargin;
var verticalMargin = 20;
var data = [13,123,3617,627,2812,3,509,3242343,1,2,4,234,243242,1,6547,756753,35235,223543,4343352];
var majorLineColor = 'grey';
var minorLineColor = 'lightgrey'
var thickBarColor = 'green';
var thinBarColor = 'black';
var canvasSize = {height: view.viewSize.height,
					width: view.viewSize.width};

// This function adds the thousands separator to a given number string
var addCommas = function(nStr) {
	nStr += '';
	x = nStr.split('.');
	x1 = x[0];
	x2 = x.length > 1 ? '.' + x[1] : '';
	var rgx = /(\d+)(\d{3})/;
	while (rgx.test(x1)) {
		x1 = x1.replace(rgx, '$1' + ',' + '$2');
	}
	return x1 + x2;
}

var calculateComponents = function(x) {
    var maxPowerOfTen = 0; // 4->0; 15->1; 18272->4
    var currentX = x;
    while ( currentX >= 10 ) {
        maxPowerOfTen += 1;
        currentX = currentX/10;
    }
    var valueAtMaxPowerOfTen = x/Math.pow(10,maxPowerOfTen);
    return {orig: x,
            val: valueAtMaxPowerOfTen,
            lvl: maxPowerOfTen};

}

var dataInComponents = [];
for (var i = 0; i < data.length; i++ ) {
    dataInComponents.push(calculateComponents(data[i]));
}
var maxLevel = Math.max.apply(Math,dataInComponents.map(function(o){return o.lvl;}))

// Create an invisible text with the largest level to see how wide it will be. This
// will be subtracted from the area that can be used for the graph
var widestLegendText = new PointText({
	point: view.center,
	content: addCommas(Math.pow(10,maxLevel)),
	justification: 'center',
	fontSize: 18,
	fillColor: 'black',
	visible: false
});

var verticalOffset = canvasSize.height - verticalMargin;

// The height each level has to be
var levelHeight = Math.floor((canvasSize.height-(verticalMargin*2))/(maxLevel + 1));

// Each subgraph is divided into 10 parts
var levelScaling = Math.floor(levelHeight/10);

// The large bars are max. 40 pixels wide or smaller if more need to fit
var thickBarWidth = Math.floor((canvasSize.width-horizontalOffset-widestLegendText.bounds.width)/((dataInComponents.length*2)-1))
if (thickBarWidth > 40) {
	thickBarWidth = 40;
}

// The thin bars are at least 2 pixels wide or wider if the thick bars are wider
var thinBarWidth = thickBarWidth / 15
if (thinBarWidth < 2){
	thinBarWidth = 2
}

for (var i = 0; i <= maxLevel; i++) {
	// X-axes are added from the horizontal margin until the last bar + the bar margin
    var line = new Path();
    line.add(new Point(horizontalMargin,verticalOffset-levelHeight*i));
    line.add(new Point(horizontalMargin+((dataInComponents.length*2-1)*thickBarWidth)+barMargin,verticalOffset-levelHeight*i));
    line.strokeColor = majorLineColor;
    var text = new PointText({
    	point: [horizontalMargin+((dataInComponents.length*2-1)*thickBarWidth)+barMargin, verticalOffset-levelHeight*i],
		content: addCommas(Math.pow(10,i)),
		justification: 'left',
		fontSize: 18,
		fillColor: 'black'
    });
    for (var j = 0; j <= 10; j++) {
    	var line = new Path();
	    line.add(new Point(horizontalMargin,verticalOffset-levelHeight*i-levelScaling*j));
	    line.add(new Point(horizontalMargin+((dataInComponents.length*2-1)*thickBarWidth)+barMargin,verticalOffset-levelHeight*i-levelScaling*j));
	    line.strokeColor = minorLineColor;
    }
}

for (var i = 0; i < dataInComponents.length; i++ ) {
    // The thin bar in the orders of magnitude smaller than the current number
    var thinBar = new Path();
    thinBar.add(new Point(horizontalOffset + i*thickBarWidth*2, verticalOffset));
    thinBar.add(new Point(horizontalOffset + i*thickBarWidth*2, verticalOffset-levelHeight*dataInComponents[i].lvl));
    thinBar.strokeColor = thinBarColor;
    thinBar.strokeWidth = thinBarWidth;
    thinBar.dashArray = [levelHeight/5, levelHeight/10]

    // The thick bar in the order of magnitude of the current number
    var thickBar = new Path();
    thickBar.add(new Point(horizontalOffset + i*thickBarWidth*2, verticalOffset-levelHeight*dataInComponents[i].lvl));
    thickBar.add(new Point(horizontalOffset + i*thickBarWidth*2, verticalOffset-levelHeight*dataInComponents[i].lvl-(dataInComponents[i].val*levelScaling)));
    thickBar.strokeColor = thickBarColor;
    thickBar.strokeWidth = thickBarWidth;

    // The thick but flat bar in the orders of magnitude larger than the current number
    for (var j = dataInComponents[i].lvl+1; j<=maxLevel; j++) {
        var placeHolder = new Path();
        placeHolder.add(new Point(horizontalOffset + i*thickBarWidth*2, verticalOffset-levelHeight*j));
        placeHolder.add(new Point(horizontalOffset + i*thickBarWidth*2, verticalOffset-levelHeight*j-1));
        placeHolder.strokeColor = 'black';
        placeHolder.strokeWidth = thickBarWidth;
    }
}