Portfolio
A selection of projects, tools and designs developed in the lab…
Visualization and design
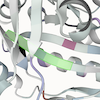 |
EProM - Exploration of Protein Modifications Our contribution to the Bio/Medvis challenge 2022 
|
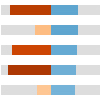 |
VAST2021 Award in Visual Analytics Human-in-the-Loop Integration of Complex and Noisy Data
|
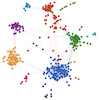 |
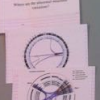
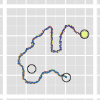
STAD on MIMIC-III Application of STAD on patient diagnosis codes
|
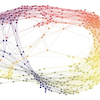 |
STAD Improving the Projection of Global Structures in Data through Spanning Trees
|
 |
Patient text browser A tool for exploring machine reading results from patient records
|
 |
Coral Visualization on early modern Flemish art
|
 |
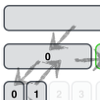
Card sorting A methodology for identifying a user's underlying goals
|
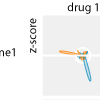 |
FlyPlot Visualizing dosage-related drug response for L1000 data
|
 |
Triovis Using trio-information to filter NGS reads
|
 |
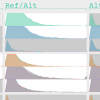
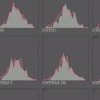
Sequence Diversity Diagram Making comparing DNA and RNA sequence motifs possible
|
 |
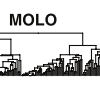
Cosmopolitan Chicken Project A data-driven art project with Koen Vanmechelen
|
 |
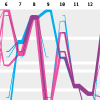
Aracari Our award-winning visualization of 2-locus eQTL data

|
 |
dendsort Modular leaf ordering method for dendrogram representations in R
|
 |
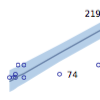
VAST 2015 Visual anomaly detection in spatio-temporal data 1
|
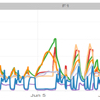 |
VAST 2016 Visual anomaly detection in spatio-temporal data 2
|
 |
VisIT Visualizing iterations over text
|
Backend
 |
Locustree Enabling and tracking multi-resolution browsing of genomic data
|
HIV
 |
HIV transmitted drug resistance See our paper Winand R et al (2015) Assessing transmissibility of HIV-1 drug resistance mutations from treated and from drug-naive individuals. Aids, 29(15), 2045–2052 |