Applying STAD to ICD9 diagnosis codes and developing a new distance metric on the way
This is work performed by Daniel Alcaide, unless otherwise mentioned. It is currently being written up.
Patient profiling and selection receive growing attention due to the large economic and societal value. The involvement of analytical methods that are able to handle the increasing amount of healthcare data can make this process more agile and facilitate, for example, patient recruitment in clinical trials. However, these processes are currently extremely labor-intensive. Here we present the application of STAD on intensive care unit patients.
A proof-of-principle interface can be found at https://dalcaide.shinyapps.io/diagnosis_explorer/. The code underlying this interface is available on github at https://github.com/vda-lab/ICD_diagnosis_explorer.
What’s the distance between diagnoses?
The MIMIC-III critical care database (described in this paper) contains deidentified health data for almost 60,000 intensive care unit patients. A lot of information is available for each patient, including a list of diagnoses (encoded using ICD-9). For see if we can find substructures in this patient population, we need to calculate distances between them, and we’ll focus on the diagnoses to do this.
Unfortunately, there is an issue: no simple distance metric exists for lists of diagnoses for patients. This is because they are categorical data (i.e. each diagnosis is a category) that are put in a specific order (i.e. the first diagnosis in the list is the most important, and importance drops as you go down the list).
| Patient X | Patient Y | ||||
| Order | ICD | Description | Order | ICD | Description |
| 1 | 99662 | Infection and inflammatory reaction due to other vascular device, implant, and graft | 1 | 4329 | Unspecified intracranial hemorrhage |
| 2 | 99591 | Sepsis | 2 | 4019 | Unspecified essential hypertension |
| 3 | 5990 | Urinary tract infection, site not specified (5990) | 3 | 99702 | Iatrogenic cerebrovascular infarction or hemorrhage |
| 4 | 4019 | Unspecified essential hypertension | 4 | 99591 | Sepsis |
| 5 | 5990 | Urinary tract infection, site not specified | |||
| 6 | 43491 | Cerebral artery occlusion, unspecified with cerebral infarction | |||
Codes 2, 3 and 4 of patient 1 correspond to codes 4, 5 and 2 of patient 2 (in that order). To make sure that not only presence/absence of a code is considered, but also its position, we can use the following distance metric:
\[M_{c_{X},c_{Y}} = ln(1 + \frac{1}{max(position_{c_{X}}, position_{c_{Y}})})\]where $c_{X}$ and $c_{Y}$ are the same code in patient X or Y, respectively.
To get to the distance between patients rather than between a single code in 2 patients, we sum these values:
\[D(X,Y) = 1 - S(X,Y) = 1 - \sum_{i=1}^{n}M(X \cap Y)\]What does such network look like?
Using this metric, the STAD network for patients in the MIMIC-III database that suffer from a “pathological fracture of vertebrae” looks like this:
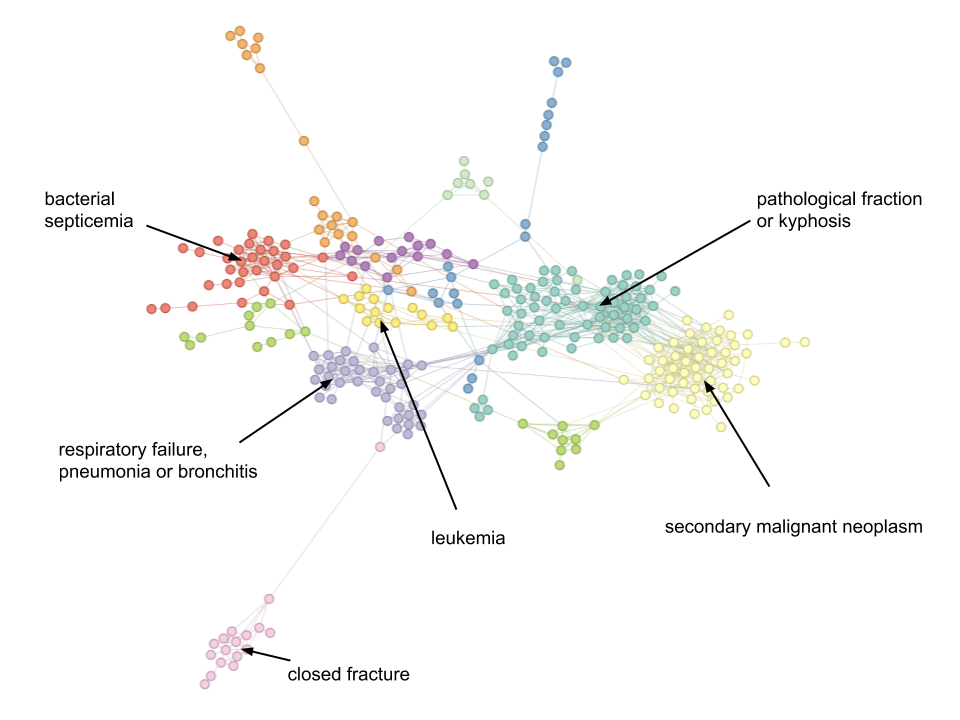
As usual, colours are assigned automatically using community detection.
A complete user interface to explore these networks can be found at https://dalcaide.shinyapps.io/diagnosis_explorer/.