Visualization of social networks supporting 17th-century tapestry industry
In the Cornelia/Coral project, Prof Koen Brosens and his group investigate the impact of community links on the cultural production of the 17th century: how do professional and social relations between actors (weavers, patrons, their families) influence the creation of tapestries.
The researchers gathered data from public records to build this network, containing several thousands nodes and links. Previous work in visualizing this network as node-link diagrams has proven not to be too useful.
In this project, Houda Lamqaddam developed custom visualizations of this network, based on interviews and using different iterations of the designs.
Goal
This visualization exercise is aimed at:
- making the archival evidence available and operational for art historians - The users want to have a tool with archival and empirical evidence as a focus. The tool has to be precise, correct and trustworthy and include evidence for the shown data.
- making a case for the use of digital tools for art historical research - The users want to demonstrate that digital tools can be used to do effective art historical research. However, there is a general skepticism in the community about such tools, due to exposure to inadequate tools primarily. One of the aims of this project is to present a proof of concept of a well designed efficient visualisation that could bring more interest to digital tools
Tasks
Different tasks were distilled from the interviews:
- identify conflicts and conflictual situations - Conflicts sometimes occur between members of a community, impacting the further personal and professional links among families and colleagues. These conflicts are interesting as they can partly explain relationship dynamics over time. The system should make it easy to see these conflicts arise.
- “freeze” the story in time - Users are sometimes interested in looking at the ties and dynamics between members of a community frozen in a specific year. The system should allow them to explore the ties in a chosen point in time.
- represent relationship density of an actor - An actor’s reputation may be deduced from the number of links they have to other members of their community.
- finding relevant time periods - Some periods in time witness more events than others. The system should assist the users in knowing the years with most changes in dynamics.
- make family structures visible - Family bonds should be visible even after the members’ deaths as their place in the community remains existing and their impact may stay valid.
Visual and interaction design
Several iterations were used to gather feedback on initial sketches.
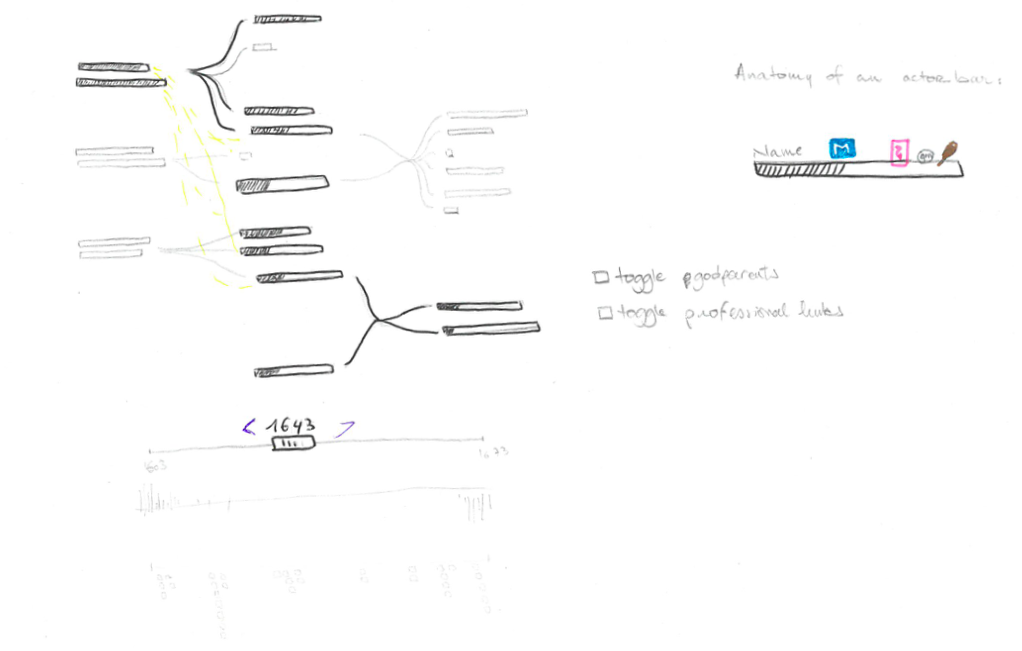
Sketch 1 - Tree-like visualization using time-slider for year selection
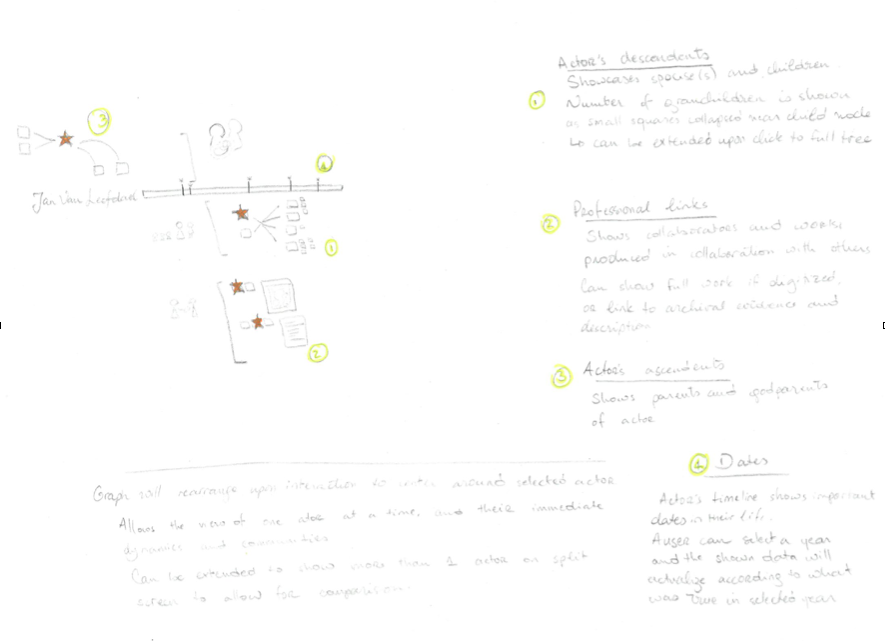
Sketch 2 - Ego-centric view focusing on one actor
A difficult aspect of the information to be displayed concerned the time-dimension, as it is important to see the network in its state at different moments in time, but also the age of an actor at those moments.
In the final design, the genealogic aspect in the data is represented in a family tree, grouped per family. Each generation is anchored at a fixed horizontal position, regardless of time. An overview of the available data across time is represented in a vertical bar.
Each person is represented by an annotated bar containing the information pertaining to them. The bar is a rectangle of fixed height, where the width is proportional to the lifespan of the person. Because a user can select to view the graph in a specific year, this rectangle - or life bar - is filled up to represent to the current age of the person.
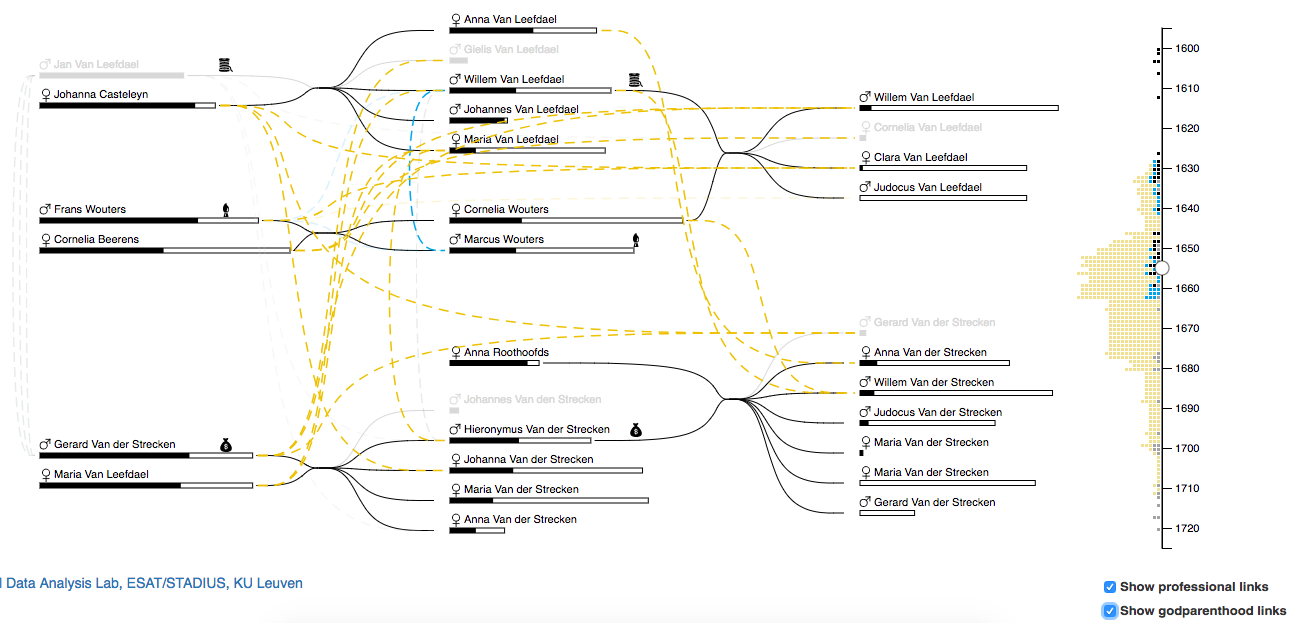
Final design
The final tool is available here.