VAST Challenge 2021 - Award for Strong Support for Visual Exploration
From the VAST challenge webpage: “The goal of the annual IEEE Visual Analytics Science and Technology (VAST) Challenge is to advance the field of visual analytics through competition.”
The VAST challenge is a prime opportunity for teambuilding in a visual analytics lab, and our contribution won the Award for Strong Support for Visual Exploration. It’s a good example of a problem that cannot be solved without involving (interactive) data visualisations.
In this year’s challenge, we try to find out why and how a group of employees disappear from a natural gas production site. All fictitious, of course.
Note: a more complete description of this work can be found in our paper. This video also goes over the same material in more detail and shows the actual interactivity.
The question
For the complete brief, see https://vast-challenge.github.io/2021/MC2.html. All names, companies and locations (e.g. islands) are fictional.
In the roughly twenty years that the GAStech company has been operating a natural gas production site in the island country of Kronos, it has produced remarkable profits and developed strong relationships with the government of Kronos. However, GAStech has not been as successful in demonstrating environmental stewardship.
In January, 2014, the leaders of GAStech are celebrating their new-found fortune as a result of the initial public offering of their very successful company. In the midst of this celebration, several employees of GAStech go missing. An organization known as the Protectors of Kronos (POK) is suspected in the disappearance, but things may not be what they seem.
You are called in to help law enforcement from Kronos and Tethys. Was it a kidnapping? Was something else going on?
The data
The data available consisted of geospatial tracking data of company cars, car assignments (which employee uses which car), a touristic map of the island that the company is located on, as well as credit card and loyalty card transactions of the two weeks leading up to the employees’ disappearance. We wanted to identify suspicious behaviours or patterns.
What the data looks like:
- corporate car assignments (44 records)
    lastname      firstname car_id employment_type        employment_title
    Calixto       Nils      1      Information Technology IT Helpdesk
    Azada         Lars      2      Engineering            Engineer
    Balas         Felix     3      Engineering            Engineer
- car GPS tracking data (for the 2 weeks preceding the event; 685,169 records)
    timestamp           id lat         long
    01/06/2014 06:28:01 35 36.0762253  24.87468932
    01/06/2014 06:28:01 35 36.07622006 24.87459598
    01/06/2014 06:28:03 35 36.07621062 24.87444293
- credit card transactions (for the 2 weeks preceding the event; 1,490 records)
    timestamp        location            price last4ccnum
    01/06/2014 07:28 Brew've Been Served 11.34 4795
    01/06/2014 07:34 Hallowed Grounds    52.22 7108
    01/06/2014 07:35 Brew've Been Served 8.33  6816
- loyalty card data (for the 2 weeks preceding the event; 1,393 records)
    timestamp  location            price loyaltynum
    01/06/2014 Brew've Been Served 4.17  L2247
    01/06/2014 Brew've Been Served 9.6   L9406
    01/06/2014 Hallowed Grounds    16.53 L8328
    ...
- tourist map of the area

- shapefile of the island (3,290 records)

    { "type": "Feature",
      "properties": { "Name": "N Hallanol Dr"},
      "geometry": { "type": "LineString",
                    "coordinates": [ [ 24.841486, 36.070512 ], [ 24.841563, 36.07042 ] ] } },
    { "type": "Feature",
      "properties": { "Name": "S Ermou St" },
      "geometry": { "type": "LineString",
                    "coordinates": [ [ 24.847478, 36.048091 ], [ 24.848369, 36.048074 ] ] } },
    ...
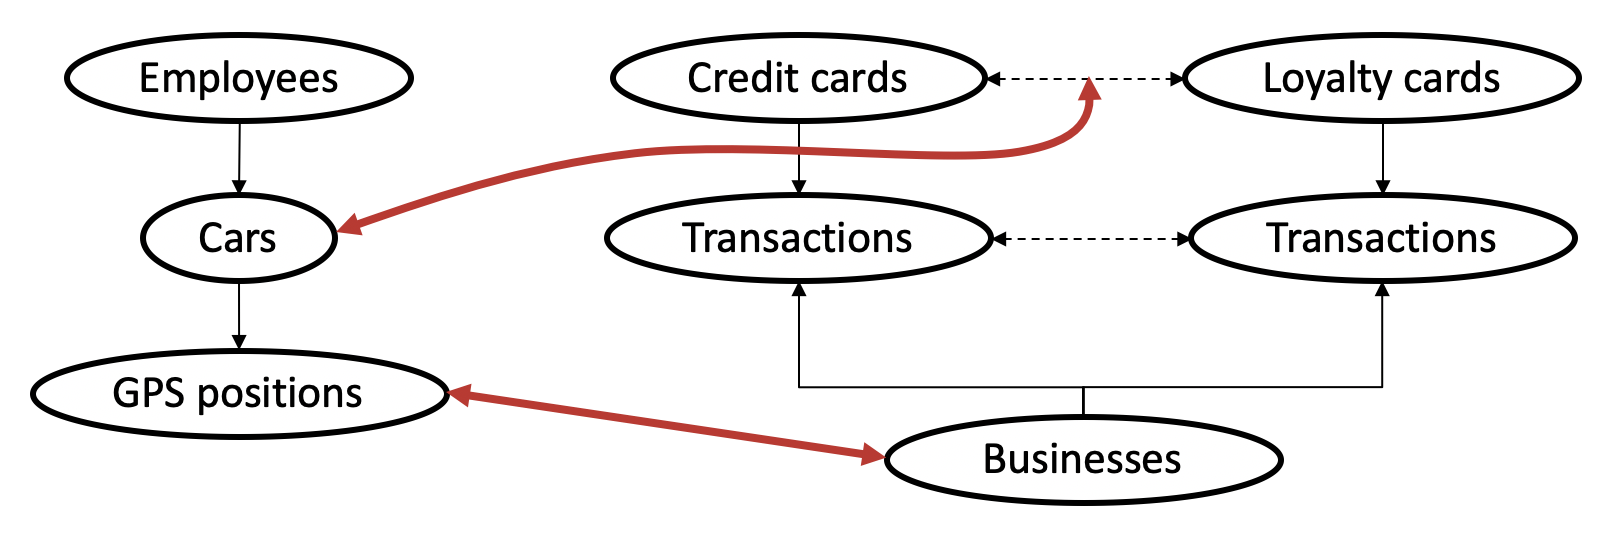
Here’s an overview of the data and how they are related:
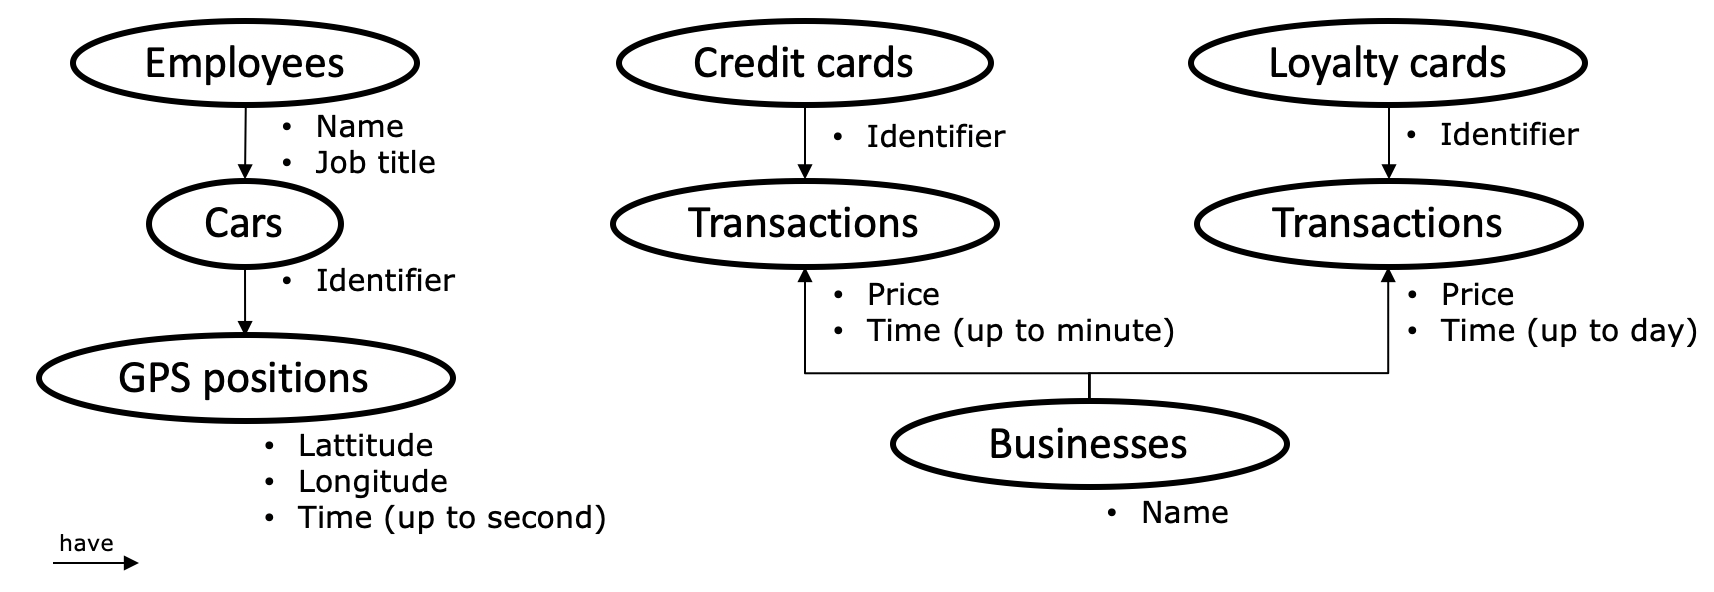
Three of these data sources share time as a common attribute. However, their granularity differed: GPS traces were accurate to the second, credit card transactions to the minute, and loyalty card transactions to the day.
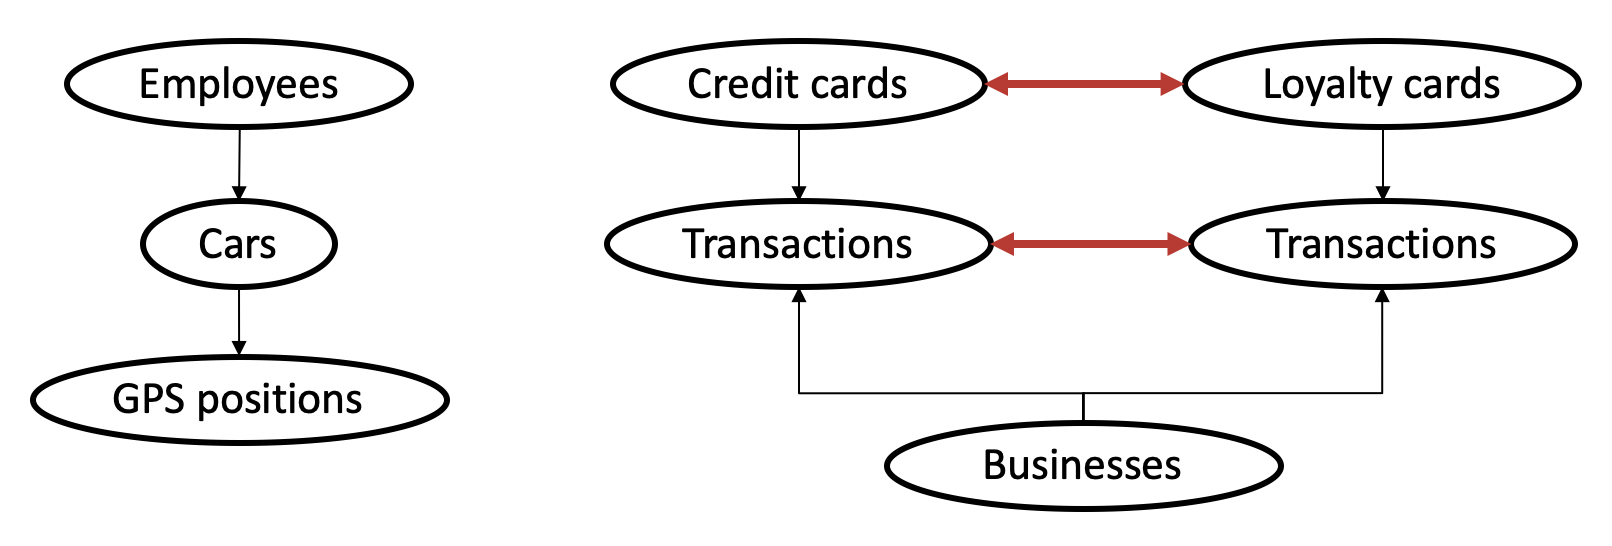
Our approach
First, we matched the transactions of loyalty cards and credit cards, assuming each employee has one of each but allowing for more complex relations. Then, we simultaneously matched cars to loyalty-credit card matches and businesses to GPS positions where cars were stationary (i.e. points of interest; POIs). Finally, we analysed meetings of people, looking for suspicious patterns.
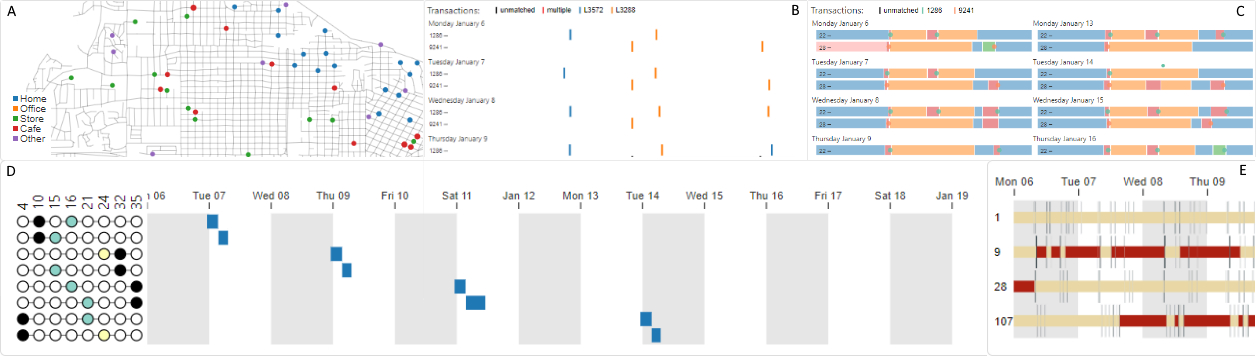
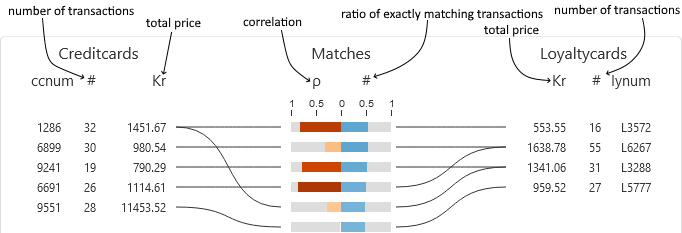
Matching credit cards with loyalty cards
We first matched credit cards with loyalty cards. We used two metrics: (1) the correlation between vectors indicating the total amount of money spent at each business on each day, and (2) the Jaccard index of card’s transaction sets, where transactions are equal when they occur at the same business on the same day for the same price.
We created two main visuals: a bipartite graph linking these two types of cards and a detailed view showing each selected creditcard’s transactions on a time-axis coloured by the matching loyalty card in a small multiple for each day.
![]()
Using these interfaces we were able to correctly match the cards and also discovered two data issues: transactions for one particular business always occurred one day earlier in the loyalty card data than in the credit card data, and some credit card transactions were precisely 20, 24, 60, or 80 units higher than their only potential matching loyalty card transaction.
Matching credit cards to cars, and finding businesses
Here’s an overview of the approach used:
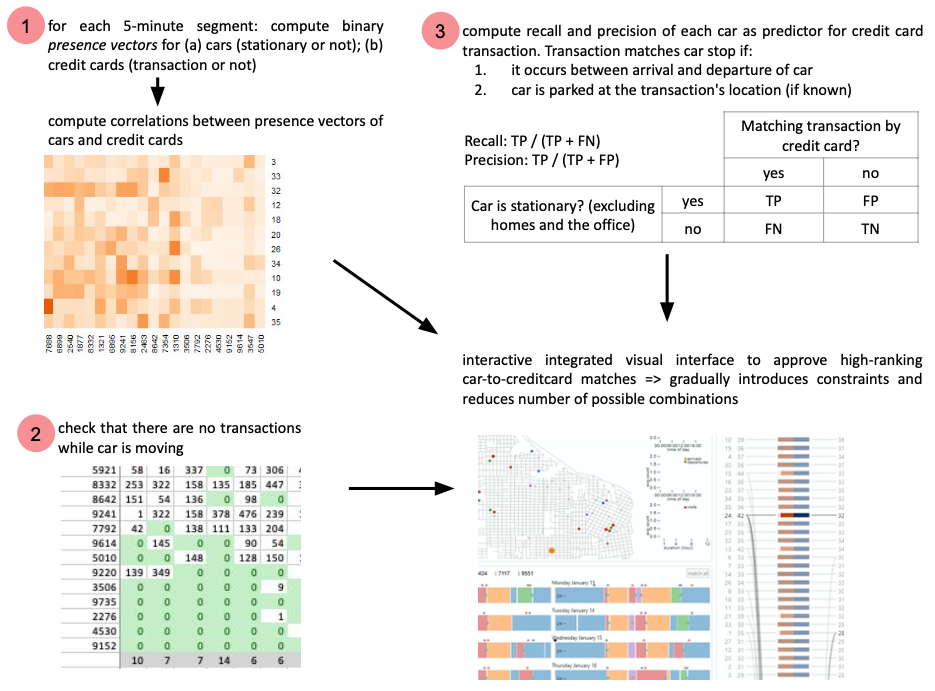
Transactions of high-rated matches were manually assigned to periods when cars were stationary, introducing POI-to-business constraints and removing the transaction and stationary period from consideration in other matches.
Using these interfaces we found several data issues, including a business whose credit card transaction times were always approximately 12 hours too late, and a car that had consistent GPS offset. We also used the interface to find out where everyone lived, based on where there cars were parked overnight.
Investigating interactions between employees
Now that all links are made (i.e. we know who was where at what time) we wanted to investigate any suspicious patterns. We found a surprise party for a particular employee one evening, a nightly guard duty at executives’ homes, two employees who meet for long lunches at the hotel, and executives who played golf together. Apart from identifying the businesses and employees’ homes, we also found other locations of interest, that were later explained to be safe houses.
For a more complete description of the analyses and visuals, as well as more of the insights we obtained, see our paper.