VisIT - Visualizing Iterations over Text
One of the issues when co-writing/editing a larger document (be it a paper or a project proposal) is that it becomes tricky to keep track of how a document changed over time. Comments that I often give on drafts include sections to be moved, thoughts to be rephrased, etc. Yes, Microsoft Word does have track changes, but that is not able to show structural changes. Moving a paragraph to another part in a document will result in a deletion and an unrelated insertion, rather a translocation (in genomics-speak). The same is true for, for example, version control in Google Documents. We have long felt that other solutions should be available to help in better understanding how different versions of a text relate to each other.
In his MSc thesis and based on preliminary work done by Houda from our group, Seiji Kumagai developed a tool for exploring large- and small-scale differences between different iterations of a text document. This represents one step towards a method for editing documents that takes their history into account.
In this work, Seiji developed visualizations at two levels: large-scale and small-scale. Two versions of a text are first analyzed to check which parts are common between them (based on the Burrows-Wheeler transform of the text).
Large scale visualization
The large-scale visualization provides an overview of the changes over the total lengths of the documents. Two visuals are presented: an alluvial diagram and dotplot (see Figure 1). The alluvial diagram basically shows the two version on top of each other and draws arcs between those parts that are common. In Figure 1, consecutive blocks of text that have matching blocks in the same order are merged, hence the grey triangular shapes. Without this aggregation, some patterns may or may not become more clear (see Figure 2). The bioinformatics-inspired dotplot gives another view on the same data. The two versions of text are laid out on the horizontal and vertical axis. Any match between the two is represented as a line in this plot.
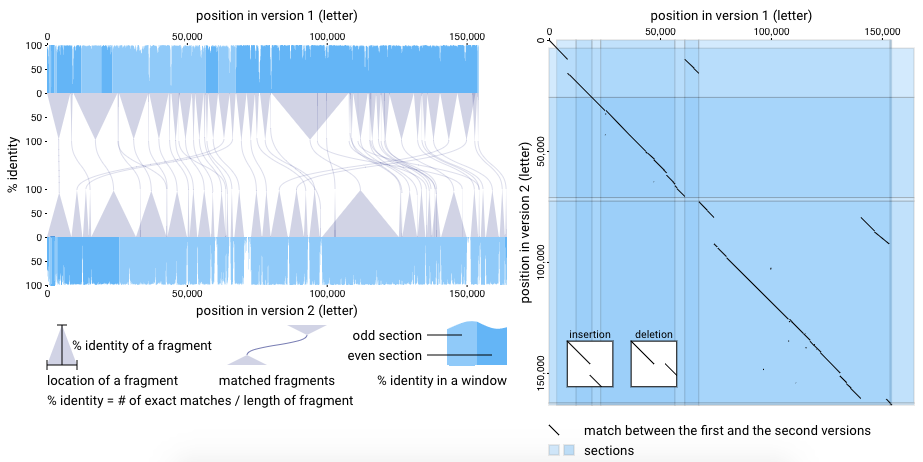
Figure 1 - Large-scale visualization. Left: alluvial diagram; right: dotplot
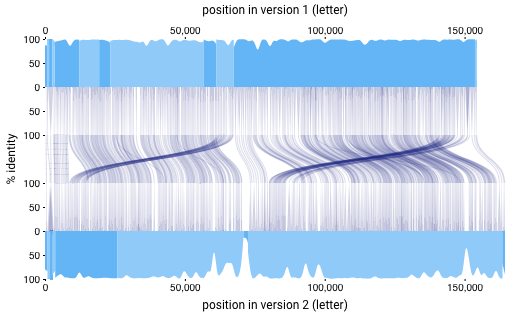
Figure 2 - Alluvial diagram without aggregation
Small scale visualization
In the small-scale visualization, the user can select a single paragraph in one of the two text versions (Figure 3, left). This will highlight all matching paragraphs from the second version and the user can then dig into the text-level similarities and differences between the versions (Figure 3, right).
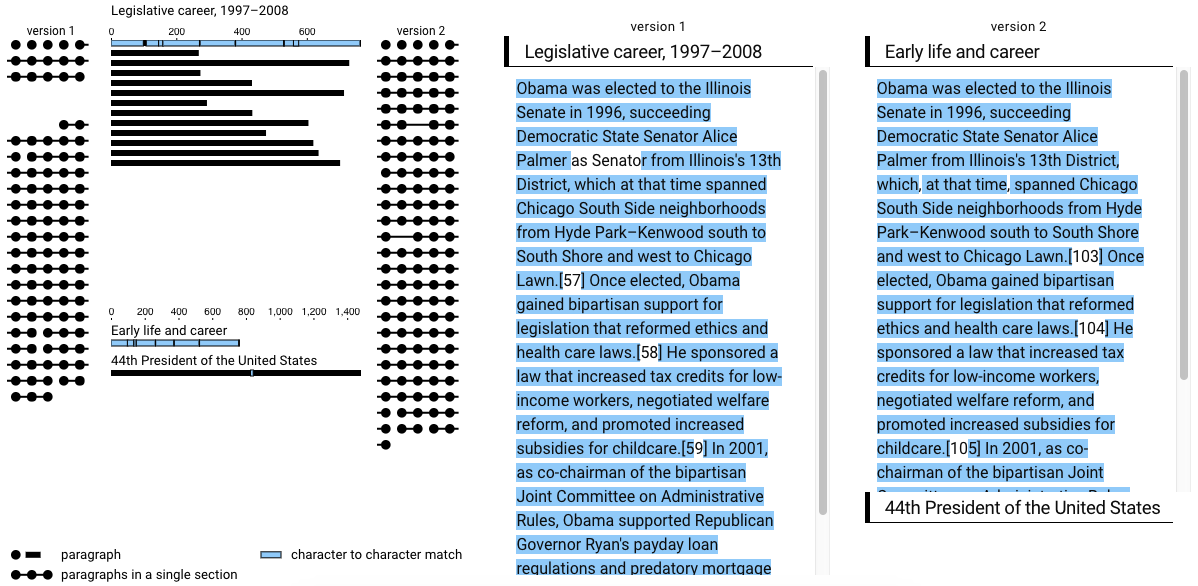
Figure 3 - small-scale visualization
Although the tool can already help to understand what’s happening with a text document, there are still several features that could make it more useful. These could e.g. be to look into more than 2 versions of the text (e.g. to capture when bits of text are repeatedly added/removed), to make annotation of these text possible, and/or to allow for live editing.
But first things first: the current tool is a good start.
VisIT can be reached at http://visit.kumagai.io.