Card sorting
Contribution by Ryo Sakai
From May 25 to 29 in 2015, I had an opportunity to attend EuroVis 2015 in Cagliari, Sardinia, Italy. This was my first time attending EuroVis and I had a really good time. It is much smaller than VIS, but you see familiar faces. The venue was really nice, and I must say I really enjoyed the Mediterranean weather. (The social event was epic.)
For this conference, we wrote this paper on card sorting technique. You can download the preprint here. The project actually goes back to my first year of the PhD study, and it was a collaboration with computational biologists to develop an interactive visualization system for studying structural variation of the human cancer genome.
Perhaps this was one of the most challenging periods in my Phd study. It was challenging because I had to build quite a bit of domain specific knowledge to “speak the same language” as the domain experts, and understand the analysis needs. Interviews after interviews, I learned something new, but yet I felt I was so far from addressing the domain problem. The analysis tasks were complex, fuzzy and inherently exploratory. There was no one specific question, and there were so many ways to approach this dataset.
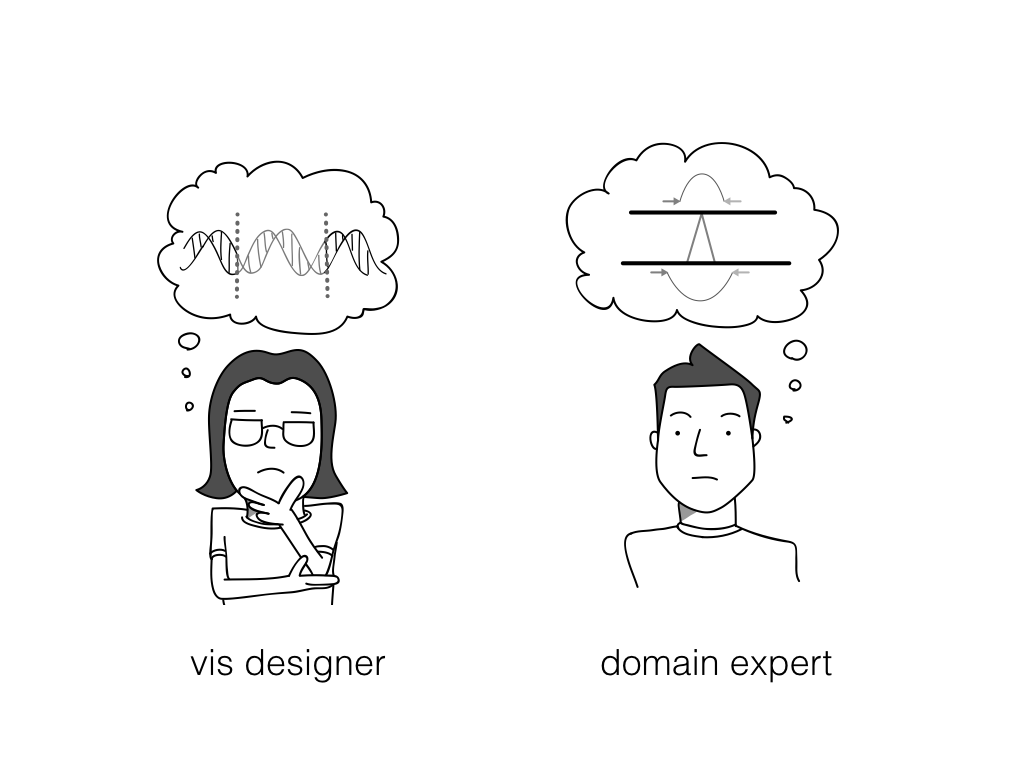
Although the domain expert was “fluent” in this domain and they knew they wanted to see the data somehow, why and how were not clear to us. We tried contextual interviews and ethnographic observations, but they didn’t work well for me. It was probably largely due to my lack of experience and skills. It takes the designer’s skill and experience to ask the right question, and the experts do not like to be watched over their shoulder while they work, even if you pretend to be a fly on the wall… Plus, the experts usually have multiple projects running, so it is hard to be at the right moment to catch a new insight about their analysis.
So, we decided to employ card sorting techniques. Details of the procedure is in the paper. One thing I didn’t emphasize enough in my presentation is that the card preparation process is not an easy process either. It takes time, but I would say it is rewarding. You will actually learn more about the domain problem, by decomposing the fuzzy and complex problem into a small and manageable components. It is like making index cards for exams. The process of making is actually a really good learning process.
You can download the slides from the presentation here
One of the questions after the presentation was, “Does the expert understand your new visual encoding design ideas in the picture card?”
And, the answer is yes and no. If you perform a closed card sorting, this is exactly the question you are trying to evaluate. As the designer, you watch carefully if the respondent can sort the card, and check if the assignment of the card is the same as you expected. In the paper, we recommend to make the picture card general enough that the respondent is not distracted by the details. At the same time, because it is very domain specific, anyone outside of this particular domain may not understand or see the encoding quite differently. The assumption here is that you (as a vis designer) and the domain expert are working towards a shared understanding of the domain problem.
The second question which I got but couldn’t quite address during the Q&A was about how abstract the visual encodings on the picture cards should be.
Again, it depends and it is up to the designer. It is an interesting spectrum to consider. This reminds of an excellent presentation by Jogoda on data sketching at the same conference. (An Exploratory Study of Data Sketching for Visual Representation. Jagoda Walny, Samuel Huron, Sheelagh Carpendale). In their paper, they introduce the spectrum of data representation, ranging from numeric to abstract. It will be interesting to see if you have a wide range of picture cards from this spectrum to link these picture cards to inquiry based cards and see if there is any trends with the types of question it addresses.
Although this paper is meant as a guideline, there are many variations and there is not only one way to do this. It depends on the domain problem, the number of respondents, the respondents, and many other factors. It also does not guarantee that you will find the answer if you follow a procedure. However, it is an exercise for the domain characterization. You (a designer) do homework to understand the domain by making cards, and you engage the domain experts and involve them in a participatory exercise. One big difference from the interview or observation techniques is that the experts are a part of this creative thinking process.
I hope you find it useful and try it out in your work. Please let us know if you have any questions, or if you try it out and have some anecdotes to share.
Links: [1]: https://dl.dropboxusercontent.com/u/50368075/EuroVis2015/RSAKAI_JAERTS_CardSorting.pdf