Radviz high-dimensional visualization using paper.js
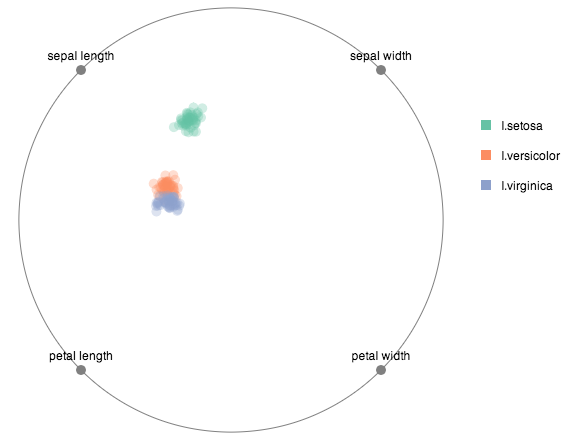
Many different approaches exist for visualizing points in high-dimensional space, including techniques such as multi-dimensional scaling and principal component analysis. Another popular option is parallel coordinates, but radviz is relatively less known. Although there are concerns about the fact that different points in multi-dimensional space can appear at the same position in the radviz visualization, it does have its uses. In the radviz approach, each dimension is represented as a point on a circle. The actual datapoints are then laid out within that circle such that the value in a particular dimension corresponds to the strength of an attraction force to the dimension-point on the circle.
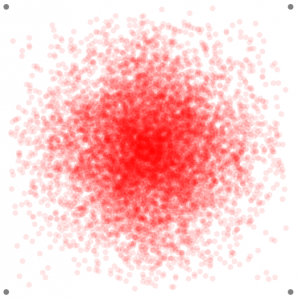
Below is is the code for placing points in 4-dimensional space in radviz. Dimension anchors are in the four corners of a square, but just image them lying on a circle :-)
function Attractor(name, x, y) {
	this.name = name
	this.x = x
	this.y = y
	this.draw = function() {
    	var a = new Path.Circle(new Point(this.x, this.y),5);
    	a.fillColor = 'grey'
    }
}

function DataPoint(attractions) {
	this.attractions = attractions
    this.forces = this.attractions.map(function(a) {return a.force})
    this.totalAttractorForce = function() {
     return this.attractions.map(function(a) {return a.force}).reduce(function(a,b) {return a+b})
    }
    this.coordinateX = function() {
        return this.attractions.map(function(a) {return a.force*a.attractor.x}).reduce(function(a,b) {return a+b})/this.totalAttractorForce()
    }
    this.coordinateY = function() {
        return this.attractions.map(function(a) {return a.force*a.attractor.y}).reduce(function(a,b) {return a+b})/this.totalAttractorForce()
    }
    this.coordinates = [this.coordinateX(),this.coordinateY()]

	this.draw = function() {
		var a = new Path.Circle(this.coordinates, 5)
		a.fillColor = 'red'
		a.opacity = 0.1
	}
}

attractorA = new Attractor('A',50,50)
attractorB = new Attractor('B',550,50)
attractorC = new Attractor('C',50,550)
attractorD = new Attractor('D',550,550)
var attractors = [attractorA,attractorB,attractorC,attractorD]
attractors.map(function(a) {a.draw()})
for ( var i = 0; i < 10000; i++ ) {
    var p = new DataPoint([{attractor:attractorA,force:Math.random()},
                            {attractor:attractorB,force:Math.random()},
                            {attractor:attractorC,force:Math.random()},
                            {attractor:attractorD,force:Math.random()}])
    p.draw()
}
A radviz representation of the Fisher’s Iris dataset: