Hands-on data visualization using D3
Introduction
D3 (data-driven documents, https://d3js.org/) is an open source JavaScript library developed by Mike Bostock, Jeff Heer, and Vadim Ogievetsky that can be used to create web-based data visualizations. If you have seen visualizations in international news papers (f.i. The New York Times), they were probably written using d3.js. An important misconception, however, is that D3 is not a charting library, and hence no ready to use templates exist. What D3 does, is provide you with a series of layout generators that you can use to draw and place elements in your visualization space based on the data you provide (driven by data).
When talking about elements, we refer to the HTML, CSS and SVG tags which can be considered as the building blocks of web-based visualizations. D3 serves more or less as the construction worker that use these building blocks to build the visualization. Like actual construction workers use all kinds of building materials (e.g. bricks, wood) to build your house. All these elements are stored as tags in your HTML page following a certain hierarchy, and the collections of these tags are referred to as the document object model (DOM). We use the following HTML template in this tutorial:
index.html
<!doctype html>
<html>
<head lang="en">
    <meta charset="utf-8">
    <title>Hands-on data visualization using D3</title>
    <meta name="description" content="A D3 tutorial">
    <link rel="icon"
      type="image/ico"
      href="./assets/favicon.ico">
    <link rel="stylesheet" type="text/css" href="./styles.css">

</head>

<body>
    <H1>Hands-on data visualization using d3 </H1>

</body>
</html>
This tutorial treats the basics of D3. You will learn how to connect your data to the document elements, add styling, and interact with it. Additional documentation can be found on the d3.js web-page, github wiki, and on Observable. To follow along with this tutorial we recommend you to install and use VSCode with the live-server extension to see a live preview of your visualization (document).
Importing D3
D3 is a modular library, meaning that you don’t always have to load the entire library. The developers have created a minified default bundle which will probably include everything you need. If you have a running network connection you can load this default bundle into your HTML script in VSCode using the URL listed on the d3.js web-page:
in the head of index.html
<head lang="en">
   ...
   <!-- import d3 -->
   <script src="https://d3js.org/d3.v6.min.js"></script>
</head>
Libraries and scripts that do not alter the DOM of a web page are typically loaded in the head of a web-page.
In case you would like to work locally without internet connection you can also choose to download the library as a zip file (d3.zip), accessible on the d3.js web-page. Once you have stored this into a local folder, you can import it into your HTML script by changing the line to:
<script src="[path to]/d3.min.js"></script>replace [path to] with the relative path from your html file to d3.min.js.
In case you need to make use of modules which are not included in the minified default bundle (e.g. d3-sankey to create Sankey diagrams), you can import them separately.
Selections
The first step in creating a web-based visualization is to add an SVG element to the body of the html page. This can be done by simply adding the SVG tag in the HTML page:
in index.html
...
<body>
    <H1>Hands-on data visualization using D3</H1>
    <svg class="flights-map" id="departures" width="600px" height="300px"></svg>
    ...
</body>
or, as we will do in this tutorial, by selecting a parent element from your HTML page using d3.js and append the SVG element to it.
in the body of index.html
...
<body>
    <H1>Hands-on data visualization using D3 </H1>
    <div class="flights-map" id="departures"> </div>

    <!-- DOM changing script for the visualization  -->
    <script>
        const parent = d3.select('#departures');
        const {width, height} = parent.node().getBoundingClientRect();
        console.log(`Found parent of size: ${width}x${height}`);

        const svg = parent.append('svg')
          .attr("width", width)
          .attr("height", height);
        console.log('Added SVG to parent');
    </script>
</body>
Here, we first select the flights-map div-element using its ID and then extract its size. Then we add an SVG element of the same size. The size and styling of the flights-map div-element is defined in the style sheet:
styles.css
.flights-map {
    width: 600px;
    height: 300px;
    border: solid #ddd 1px;
    border-radius: 5px;
}
This approach uses the d3-selection module, which will be the most important module when using D3 as it allows you to select elements within the DOM and modify them. D3 provides two selection functions: d3.select() and d3.selectAll(). The former returns a selection object with the first element that matches the specified selector (the body element in our previous example). The latter returns all elements that match the selector. Selectors are typically specified using tag names, a specific ID or via classes. A full list of all possible selectors can be found on w3schools. Once you have selected an element, you can use it to read or modify its properties, like styles, classes, attributes and text contents. In the example above we selected the div-element with the “departures” ID, appended an SVG element to it, stored the SVG-selection as a variable in javascript, and set its width and height attributes.
The next step is to start drawing in our SVG element. Suppose we want to plot a circle on the SVG based on a single x and y coordinate. Notice that we already selected the SVG element and stored it as a constant under the name svg. We therefore don’t have to select it again using the .select() function but can simply use it to append a circle. The circle is given an x coordinate of 150, a y coordinate of 30, a radius of 20, and is colored blue. To get more information on the basic SVG shapes and their corresponding attributes you can visit mozilla’s documentation page.
in the script-element of index.html
    ...
    svg.append("circle")
      .attr("cx", 150)
      .attr("cy", 30)
      .attr("r", 20)
      .attr("fill", "blue");
The visualization should now look like this:
Notice that now you see the circle near the top of your SVG, whereas you might expect it to be near the bottom. This is because the SVG coordinate system is different from a traditional scatter-plot coordinate system. By default, the origin of the SVG coordinate system lies at the upper left corner. This means that the y values in our data need to be reversed to be displayed correctly in the SVG element.
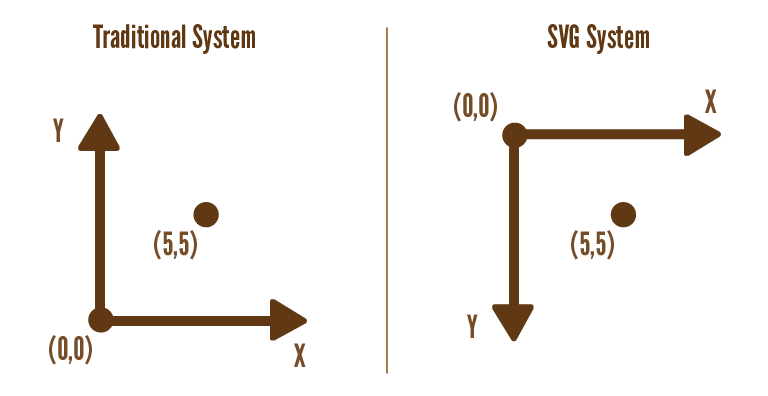 Image obtained from: https://pandaqitutorials.com/Website/svg-coordinates-viewports.
It is possible to change the coordinate systems using the viewbox attribute, as explained at geeksforgeeks.
To place the airports inside of the SVG based on their longitude and latitude coordinates, we have to make use of a scale that acts as an interpolator and maps the longitude and latitude coordinates from the data onto the dimensions of the SVG.
in the script-element of index.html
    ...
    const xScale = d3.scaleLinear()
      .domain([-180, 180])
      .range([0, width]);
    const yScale = d3.scaleLinear()
      .domain([-90, 90])
      .range([height, 0]);
    console.log('Created x and y scales');
d3.scaleLinear() provides us a linear scale, in which we specify the dimensions of the data in the .domain() property and the dimensions of the SVG in the .range() property. Note that for the y scale the order is reversed, this is because of the SVG coordinate system which origin lies at the top left corner. We now can use these scales to map each flight’s location to pixels on the SVG:
    const x = xScale(longitude);
    const y = yScale(latitude);
Properly projecting geographical locations onto a 2D plane is more complicated than the 2 linear scales we used here. See the d3-geo module for information on geographic projections in D3.
Loading the data
D3 provides a set of parsing functions that can be used to load your data file. Since we will be working with the flight.csv data set we will be using d3.csv(), but other options exist. These functions are asynchronous because loading data is usually quite slow. That means that we can start loading the data in the background and continue preparing the visualization. When both tasks are done, we can populate the visualization with the data. The script below shows the structure of this process.
structure of the script tag in index.html
// 1. Start loading the data and specify callback
d3.csv('./assets/flights.csv')
  .then(flights => {
    // 3. Evaluated once everything is prepared AND the data has loaded
    console.log('--- Populating with data:')
    console.log('Example data point: ')
    console.log(flights[0]);

    // 4. Draw the flights
    ...
  });

  // 2. Setup everything that does not require the data yet.
  ...
On the first line we start loading the data. The second line specifies a callback function that will be evaluated once the entire script has been executed and the data has finished loading. This callback has access to all variables created in the script. We will use it to actually draw the flights. The remainder of the script is used to prepare the visualization: appending the SVG element and creating scales and axes as shown in the previous section.
You might be surprised by the way we wrote the callback function. Javascript has several ways to write a function. In this tutorial we often use the arrow notation:
const mySumFunction = (a, b) => a + b;
console.log("1 + 2 = ", mySumFunction(1, 2));
Here a and b are the input parameters and the result of the statement after the arrow a + b is returned automatically. When using multiple statements in an arrow-function, you have to return values explicitly:
const myWeirdFunction = (a, b) => {
    const c = a + b;
    const d = b - a;
    return c + d;
};
console.log("1 + 2 != ", myWeirdFunction (1, 2));
Now we have loaded the data, we want to append a circle element in the SVG for all flights in the flight.csv data set. To do so, we have to bind our data values to the DOM elements. This can be done either by the .data(array) or .datum(object) functions, which contain the data that should be mapped to the DOM. Once the data is specified, we can bind it to DOM elements using the .enter() and .append() functions. The .enter() method returns all data elements which are not yet present in the DOM, but are provided by the .data(). Followed by the .append() function, the data elements get connected to the DOM. In the .append() function you can specify the elements you want to use in the DOM to bind your data to.
The complete index.html now looks like this:
index.html
<!doctype html>
<html>
<head lang="en">
    <meta charset="utf-8">
    <title>Hands-on data visualization using D3</title>
    <meta name="description" content="A D3 tutorial">
    <link rel="icon"
      type="image/ico"
      href="./assets/favicon.ico">
    <link rel="stylesheet" type="text/css" href="./styles.css">
    <script src="https://d3js.org/d3.v6.min.js"></script>
</head>

<body>
  <H1>Hands-on data visualization using D3</H1>

  <div class="flights-map" id="departures"></div>
  <script>
    // Define constant visual parameters
    const alpha = 0.01;
    const sizeRange = [2, 7];
    // Start loading the data asynchronously
    d3.csv('./assets/flights.csv')
      // Once the data is loaded run the following function
      //    Guaranteed to happen only after the entire script
      //    block has been evaluated!!!
      .then(data => {
        console.log('--- Populating with data:')
        console.log('Example data point: ')
        console.log(data[0]);
        // Populate the visualization with the data
        dataLayer.selectAll('circle')
          .data(data)
          .enter()
          .append('circle')
            .attr('opacity', alpha)
            .attr('fill',  d => d.from_country === d.to_country
              ? 'rgb(255, 0, 0)'
              : 'rgb(0, 0, 255)')
            .attr('cx', d => xScale(d.from_long))
            .attr('cy', d => yScale(d.from_lat))
            .attr('r', d => rScale(d.distance));
        console.log('Added flights!');
        console.log('Done :)');
      });
    // Setup everything that does not require the data yet.
    //    This is evaluated before the data is loaded!!!
    console.log('--- Setting up visualization:');
    // Select the visualization div and retrieve its size
    const parent = d3.select('#departures');
    const {width, height} = parent.node().getBoundingClientRect();
    console.log(`Found parent of size: ${width}x${height}`);
    // Add an svg element with the same size as the parent
    const svg = parent.append('svg')
      .attr("width", width)
      .attr("height", height);
    console.log('Added svg to parent');
    // Add an svg-group so we can separate data-points, legends and
    // annotations
    const dataLayer = svg.append('g');
    console.log('Added data layer');
    // Create scales to map location to the screen.
    const xScale = d3.scaleLinear()
      .domain([-180, 180])
      .range([0, width]);
    const yScale = d3.scaleLinear()
      .domain([-90, 90])
      .range([height, 0]);
    const rScale = d3.scaleLinear()
      .domain([1, 15406])
      .range(sizeRange);
    console.log('Created x, y, and r scales');
  </script>
</body>
</html>
We explain how setting the attributes of a circle works in the scales and axes section.
General update pattern
The framework behind the data binding is called the “general update pattern”. It consists of 3 steps: entering, updating, and removing elements. So far we have created elements in the DOM based on the data, and did not consider that the data could change. When the data array gets smaller or bigger, or when values change while the code is running the DOM elements need to change accordingly. When there is an equal amount of data items and DOM elements, we just want the elements to update if data values change. When there is more data than DOM elements we want to bind the new data items to the DOM, and when there are more DOM elements than data we want the unnecessary data to be removed from the DOM. When updating, we just need to call the data again and update the selection based on the new data values. To demonstrate this, we will use a sample of 500 flights selected from the data and add a button that whenever clicked on the data gets resampled. Since the data will always be an array of 500 data items, there is no need to add or remove elements from the DOM. We just need to update the circle element’s x and y coordinates, and color.
changes in index.html
...
<body>
  ...
  <input type="button" id='resample' value="Resample" onclick="resampleAndDraw()"/>
  <script>
	...
	let data = null;
  ...
  d3.csv('./assets/flights.csv')
  .then(flights => {
      ...
      data = flights;
  });
  ...
  function resampleAndDraw() {
    if (!data) {
      return;
    }
    // Not efficient but it works...
    const dataSample = d3.shuffle(data).slice(0, 500);
    dataLayer.selectAll('circle')
      .data(dataSample)
      .attr('opacity', alpha)
      .attr('fill',  d => d.from_country === d.to_country
        ? 'rgb(255, 0, 0)'
        : 'rgb(0, 0, 255)')
      .attr('cx', d => xScale(d.from_long))
      .attr('cy', d => yScale(d.from_lat))
      .attr('r', d => rScale(d.distance));
  }
    </script>
</body>
Imagine we were using an API and our data would increase over time, we need to bind these new data items to the DOM as well. Extra data is stored in the enter array and can be accessed using the enter() function. In practice, we select all circle elements again in the DOM, set the new data array, select all new data items, bind these new data items to the DOM using circles, and set the circle attributes according to the data values.
  svg.selectAll(“circle")
    .data(data)
    .enter()
    .append(“circle")
      .attr(...)
      ...;
D3 however provides a simpler way to do this, using the .merge() function. It combines both updating and entering in one single step. Specifically, this means that you only need to specify the attributes once for both the updating and entering.
svg.selectAll('circle')
    .data(data)
    .enter() //select the new data items
    .append('circle') // bind them to the DOM
    .merge(selection) // merge them with the data items already bound to the DOM.
      .attr(...)
Suppose we want to set a filter function on our data and only display the flights of a certain distance depending on the mouse coordinates. This means that our data could also decrease and thus elements need to be removed from the DOM. When this happens, all elements that are no longer needed are moved to the exit array property which can be obtained using the .exit() function. After calling these objects, we can remove them from the DOM using the .remove() function.
svg.selectAll('circle')
  .data(data)
  .exit()
  .remove();
To make things simpler, D3 contains an additional function that does the entire general update pattern (updating, entering, exiting) in one single step. When using .join(), there is no need to explicitly call the .enter(), .update() and .exit() functions.
svg.selectAll('circle')
  .data(data)
  // append and remove circles in the DOM to match the data
  .join('circle')
    // set their attributes
    .attr(...);
If you wish to control what happens in each enter, update and exit step though, you can specify the steps as functions inside the .join() function. This pattern provides the most flexibility, allowing for optimisations, while being relatively simple to reason about.
svg.selectAll('circle')
  .data(data)
  .join(
    // add DOM elements for new data and set fixed attributes
    enter => enter.append('circle')
      .attr(...),
    // set attributes that only change on update
    update => update
      .attr(...),
    // remove DOM elements that are not in the data anymore
    exit => exit.remove()
  )
  // set attributes on both the enter and update selections
  .attr(...);
See this observable page for more information about joins in D3.
Scales and Axes
The d3-scale module provides very useful functions for mapping your data to graphical aspects. It includes a collection of scale generator functions that can be used to fit data values into graphical dimensions, but also as interpolators, for instance, to convert data values into colors. In the previous example we used a linear scale to convert longitude and latitude values into the SVG dimensions. The domain functions contain the dimensions of the data column and the graphical dimensions you want to convert it to are given in the range property. Note that for the y-scale the range is reversed, this is because of the SVG coordinate system which origin lies at the top left corner.
 const xScale = d3.scaleLinear()
    .domain([-180, 180])
    .range([0, width]);
const yScale = d3.scaleLinear()
    .domain([-90, 90])
    .range([height, 0]);
The scale functions are stored as const variables, so they cannot be overwritten. However, the domain and range of the scales can be changed by simply calling .domain(..) or .range(...) on the scale. The scales are used to set attributes of selected DOM elements using the .attr(...) function. This function takes the name of the attributes you want to change and either a single value or a function that returns a value for each data-point. In the example below, the opacity is the same for all flights, so the .attr() function is given a fixed value. The position and radius differ for each flight, so these .attr() invocations are given a function that applies the relevant scale for each data-point. We use the arrow function notation, where d is the input and will contain a single data-point and the statement after => is returned. For the fill attribute we used a conditional operator, essentially an if-else statement: some condition ? true-case : false-case. When to_country and from_country are the same, the fill is red, otherwise it is blue.
svg.selectAll('circle')
    .data(dataSample)
    .enter()
    .append('circle')
    .attr('opacity', 0.03)
    .attr('fill',  d => d.from_country === d.to_country
        ? 'rgb(255, 0, 0)'
        : 'rgb(0, 0, 255)')
    .attr('cx', d => xScale(d.from_long))
    .attr('cy', d => yScale(d.from_lat))
    .attr('r', d => rScale(d.distance));
For additional information on scales, you can consult the d3-scale github repository, or check Observable for examples. In case you want to use scales to represent data values by color, D3 provides a set of ready to use color schemes that can be used in ordinal, sequential, and diverging scales, depending on your data. These functions can be found in the d3-scale-chromatic github repository. When using one these predefined color schemes, you don’t need to explicitly specify the range property anymore as this is provided by the color schemes. A typical example of how you want to use these looks like this:
const ordScale = d3.scaleOrdinal(d3.schemeCategory10).domain([v1,...,vn]);
const seqScale = d3.scaleSequential(d3.interpolatePiYG).domain([min, max]);
const divScale = d3.scaleDiverging(d3.interpolateBrBG).domain([min, mid, max]);
D3 also contains the d3-axis module which contains ready to use one-dimensional SVG axes that you can attach to a scale. Be aware that all axes, just like every other svg element, are positioned relative to the origin of the SVG coordinate system. You’ll need to position the axis yourself using a transform attribute. In this example, the axis is moved 30 pixels downwards.
const axis = d3.axisLeft(scale);
svg.append("g")
  .attr("transform", "translate(0,30)")
  .call(axis);
Note that, like with the scales, the axis variable contains a function. To draw the axis, this function has to be called with the selection that it should draw to: axis(g). D3 provides the .call() method for this purpose. This method takes a function as argument and calls it with current selection. So svg.append('g') appends an SVG group and returns a selection of that group. .attr(...) sets the attributes of the svg group, in this case the transform. Then, .call(...) takes the axis function and calls it with the SVG group selection, so that the axis function knows where to draw to.
To obtain the dimensions of your data, D3 provides three useful functions: d3.min(), d3.max(), and d3.extent(), which return the minimum, maximum, and both minimum and maximum of an array, respectively.
d3.min([3, 2, 1, 1, 6, 2, 4]) // 1
d3.max([3, 2, 1, 1, 6, 2, 4]) // 6
d3.extent([3, 2, 1, 1, 6, 2, 4]) // [1, 6]
The argument to these functions can also be an array of objects. In that case, they need a second argument that extracts the value you are interested in:
d3.min(flights, d => d.distance) // minimum distance over all flightsInteractivity
To add interactivity to your visualization, D3 contains some functions to extend and simplify JavaScripts native event handling. Using the .on() function, you can register an event listener on elements like e.g. ‘click’. In our example we want to filter flights based on our mouse coordinates. When the mouse is moved to the left of the screen, only short distance flights will be shown, and when moving further to right more distant flights will appear as well. This can be done by specifying an event listener on the svg element, that will return us the x coordinate of the mouse within the svg. The code looks as follows:
svg.on('mousemove', (event) => {
  const [mx, my] = d3.pointer(event, dataLayer.node());
  drawFlights(data, x2distance(mx));
});
The first argument inside the on() function provides the name of the event, ‘mousemove’ for this example. The second argument needs to be a function which will be called every time the event happens. So, every time the mouse is moved within the svg, the callback is invoked. A list of all possible DOM events can be found at w3schools. In our callback we save the x and y coordinates of the cursor obtained via the d3.pointer() function, and use the x-coordinate to filter and re-draw the data. Note that d3.pointer() computes the mouse position from the event variable relative to its second argument. In this case, we used the dataLayer because SVG groups may have a transform that should be considered. In this example dataLayer could be replaced by svg without problems though.
the complete script-tag looks like:
// Define constant visual parameters
const alpha = 0.3;
const radius = 2;
const sizeRange = [1, 10];

// Start loading the data asynchronously
d3.csv('./assets/flights.csv')
  // Sample 1000 flights so the animation is not too slow...
  .then(data => d3.shuffle(data).slice(0, 1000))
  // Once the data is loaded run the following function
  //    Guaranteed to happen only after the entire script
  //    block has been evaluated!!!
  .then(data => {
    console.log('--- Populating with data:')
    console.log('Example data point: ')
    console.log(data[0]);

    // A filter function: returns true if a flights distance is
    // within 50 miles of the given distance value t
    const within50Miles = (d, t) => {
      return d.distance < t + 25 && d.distance > t - 25;
    }
    // Create a function that draws the flights given the
    // data and a distance target.
    const drawFlights = (data, target) => {
      // Use all data if the target is not specified
      const filteredData = target
        ? data.filter(d => within50Miles(d, target))
        : data;

      dataLayer.selectAll('circle')
        .data(filteredData)
        .join('circle')
          .attr('opacity', alpha)
          .attr('r', radius)
          .attr('fill', d => d.from_country === d.to_country
            ? 'rgb(255, 0, 0)'
            : 'rgb(0, 0, 255)')
          .attr('cx', d => xScale(d.from_long))
          .attr('cy', d => yScale(d.from_lat));
    };

    // Draw the initial flights
    drawFlights(data, null);
    console.log('Added flights!');
    console.log('Done :)');

    // Register a mouse movement callback
    //   this has to happen after the data is loaded
    //   because we need the data to draw flights.
    svg.on('mousemove', (event) => {
      const [mx, my] = d3.pointer(event, dataLayer.node());
      drawFlights(data, x2distance(mx));
    });
    // Make sure to show all data points when the mouse is not
    // over the visualization!
    svg.on('mouseleave', (_) => {
      drawFlights(data, null);
    });
  });

// Setup everything that does not require the data yet.
//    This is evaluated before the data is loaded!!!
console.log('--- Setting up visualization:');

// Select the visualization div and retrieve its size
const parent = d3.select('#departures');
const {width, height} = parent.node().getBoundingClientRect();
console.log(`Found parent of size: ${width}x${height}`);

// Add an svg element with the same size as the parent
const svg = parent.append('svg')
  .attr("width", width)
  .attr("height", height);
console.log('Added svg to parent');

// Add an svg-group so we can separate data-points, legends and
// annotations
const dataLayer = svg.append('g');
console.log('Added data layer');

// Create scales to map location to the screen.
const xScale = d3.scaleLinear()
  .domain([-180, 180])
  .range([0, width]);
const yScale = d3.scaleLinear()
  .domain([-90, 90])
  .range([height, 0]);
// Use x-mouse coordinate to filter flights based on distance
const x2distance = d3.scaleLinear()
  .domain([0, width])
  .range([0, 15406]);
console.log('Created x, y, and x2d scales');
Important to know is that these event listeners can be set on any element inside the DOM, and thus it could also be set on the circles itself. The following example highlights a circle with a red color when you hover over it with the mouse.
dataLayer.selectAll('circle')
  .data(dataSample)
  .join('circle')
    .attr('opacity', 0.03)
    .attr('fill', "gray")
    .attr('cx', d => xScale(d.from_long))
    .attr('cy', d => yScale(d.from_lat))
    .attr('r', d => rScale(d.distance))
    .on('mouseover', function() { d3.select(this).attr("fill", "red")})
    .on('mouseleave', function() { d3.select(this).attr("fill", "gray")});
Note that the mouse-callbacks were written as traditional functions! Arrow-notation would not work here, because the this keyword behaves differently in arrow functions. In arrow functions the this object is taken from the scope the function is defined in. In traditional functions, this is determined from how the function is called (see f.i. this explanation). The main takeaway is this: use traditional functions when you need the this keyword for setting callbacks in D3.
For the second example demonstrating mouse events, we will duplicate the map and plot departure airports on the top map and arrival airports on the bottom map. Our cursor can now act as a brush to highlight the arrival airports of flights in the departures-map. The same principle applies as in the first example. We set an event listener on both SVG elements, that runs a function every time the mouse moves inside one of the SVG. Again cursor coordinates are captured via the d3.pointer() function, and are used to select all elements which fall inside a radius of 10 pixels inside our custom isSelected function. This function returns true for all elements which fall inside this brush radius. These are then provided to the drawDepartures and drawArrivals functions which will update the circle elements accordingly, using the general update pattern.
// Register a mouse callback on the departures svg
//    dSVG is the svg selection for departures
//    dLayer is the svg-group of departures svg
dSVG.on('mousemove', (event) => {
  const mouseXY = d3.pointer(event, dLayer.node());
  const filter = d => {
    const flightXY = [xScale(d.from_long), yScale(d.from_lat)];
    return isSelected(flightXY, mouseXY);
  };

  drawDepartures(filter);
  drawArrivals(filter);
});

// Register a mouse callback on the arrivals svg
//    aSVG is the svg selection for arrivals
//    aLayer is the svg-group of arrivals svg
aSVG.on('mousemove', (event) => {
  const mouseXY = d3.pointer(event, aLayer.node());
  const filter = d => {
    const flightXY = [xScale(d.to_long), yScale(d.to_lat)];
    return isSelected(flightXY, mouseXY);
  };

  drawDepartures(filter);
  drawArrivals(filter);
});

// Filter function that returns true for points within 20px of the mouse
const isSelected = (dataXY, mouseXY, brushRadius = 10) => {
  const dx = dataXY[0] - mouseXY[0];
  const dy = dataXY[1] - mouseXY[1];
  const distance =  Math.sqrt(dx * dx + dy * dy);
  return distance < brushRadius;
}

// This function draws departure locations of flights.
const drawDepartures = (isSelected) => {
  dLayer.selectAll('circle')
    .data(data)
    .join('circle')
      .attr('opacity', d => isSelected(d) ? 1 : 0.03)
      .attr('r', radius)
      .attr('fill', d => isSelected(d) ? 'rgb(255, 0, 0)' : 'rgb(0, 0, 255)')
      .attr('cx', d => xScale(d.from_long))
      .attr('cy', d => yScale(d.from_lat));
}

// This function draws arrival locations of flights
//    Only the target layer and cx, cy data-fields are different.
const drawArrivals = (isSelected) => {
  aLayer.selectAll('circle')
    .data(data)
    .join('circle')
      .attr('opacity', d => isSelected(d) ? 1 : 0.03)
      .attr('r', radius)
      .attr('fill', d => isSelected(d) ? 'rgb(255, 0, 0)' : 'rgb(0, 0, 255)')
      .attr('cx', d => xScale(d.to_long))
      .attr('cy', d => yScale(d.to_lat));
Departures:
Arrivals:
Note that we used a custom brush interaction. D3 also provides a pre-built brush module called d3-brush, that can be used for both one- and two-dimensional brushing.
Animation
To improve the readability of your visualizations when using interactive features, it can be handy sometimes to add transitions. These can help to show which elements are changing and how they are changing. This can easily be implemented in D3 by simply inserting the .transition() function in front of the attributes that will change.
d3.select("body")
  .transition()
    .style("background-color", "red");
You can customize transitions using its methods like .duration() and .delay() in which you can specify the duration of the transition and add a delay to the start of the transition, specified in milliseconds. More information on transitions is provided at the d3-transition github repository.
How would you add transitions to the previous example?
Departures:
Arrivals: