Teaching Visual Design in Data Science... Remotely
This post accompagnies our paper “Remote Instruction for Data Visualization Design - A Report from the Trenches” in Computer Graphics & Applications [REF TO BE ADDED]. It provides additional links as well as a quantification of the number of sketches generated by the students, both individually and as groups.
Technical setup
To successfully run a remote interactive visual design session, we set the following requirements of the software to be used. Students need to be able to:
- communicate in separate groups
- maintain “connection” to the rest of the groups and the teaching team
- make quick sketches and share these with their peers
- discuss and organize sketches that they created
- indicate that they need support
Teaching assistants and lecturer need to be able to:
- interact with the groups separately
- address all students simultaneously
- keep an overview of how students are doing during the exercises
In addition, the system should allow for self-organization, in that it provides a clear overview of the situation and allows for dynamic adaptation. Based on these requirements, we opted for a combination of pen and paper, GatherTown for general communication, and Miro for collaboration.
Gather.town
Gather is a video chat platform designed to make virtual interactions more human. Users can build their own custom, intractable spaces (e.g. virtual offices, university campuses and conferences). For the Data Visualization in Data Science course, a workshop room was established in the by UHasselt provided online campus. This room provides proximity chat (i.e., people can hear each other when they are located close to each other), but also featured a single “spotlight square” (i.e., standing in this position makes everyone in the room hear you, see you, and optionally view your screen). This spotlight square was used for giving general instructions and announcements to the students. In addition, different“private spaces” were set up, consisting of a table and six chairs. Everyone can hear each other in a private space, but cannot be heard by someone outside of the space (i.c., not sitting on a chair at the same table) and vice versa. Each table is numbered; this number corresponds to a working space in the collaboration platform, as mentioned before.
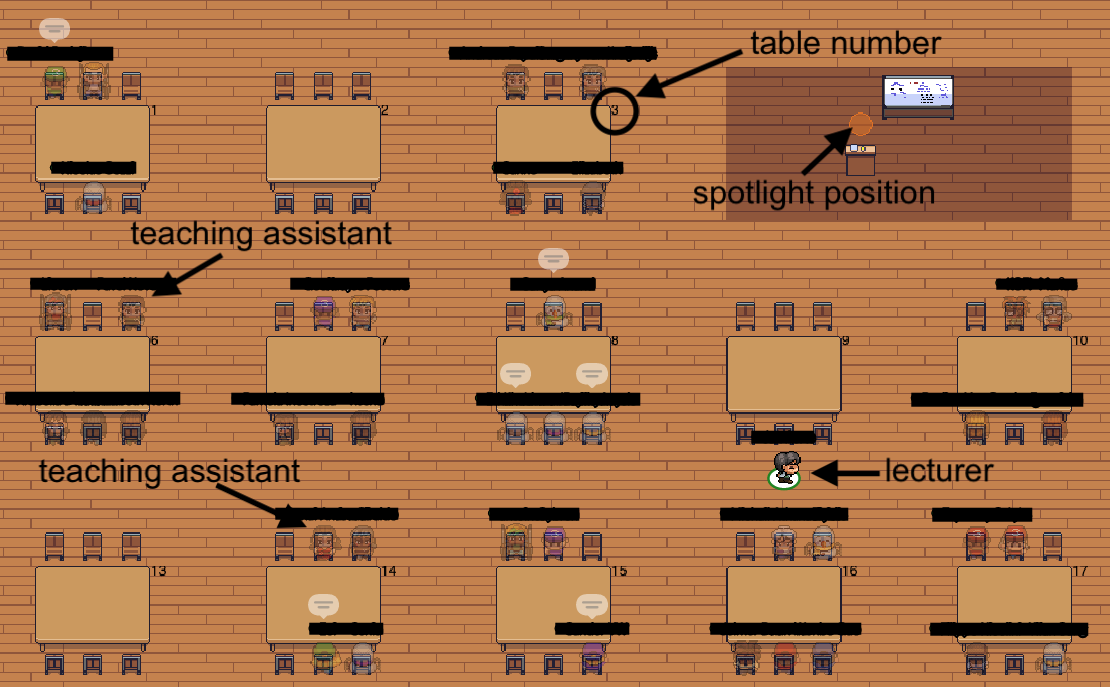
(Part of) virtual classroom in communication platform. Students are distributed across different tableswhich correspond to different private spaces. Teaching assistants and lecturer can join a table to join thatconversation. The spotlight position allows for addressing everyone in the room. Table numbers correspond toworking space numbers in the collaborative boards.
In order for the students to get familiar with the environment, an introduction meeting was held before, organised by the university. During this session, students could get a first experience on how to navigate, chat, raise hands, and communicate with each other. We want to refer you to the gather 101 and gather 102 walkthroughs to get familiar with the environment yourself, and to use as guidance to organise such a session.
Miro
General
Miro is an online collaborative whiteboard environment, which we believe is easy to work with and provides many usefull features. To get the students familiar with the tool, we created a “How to work with Miro” board, and asked them to watch an introduction video provided by Miro itself. In the introductory board, students were asked to start at the green star and follow the arrows, completing some simple exercises such as adding a sticky note, drawing a circle, placing a comment, etc. One of the questions (3) was to put their names on a post it, and arrange these to form groups for the later stage of the course. In question 4, we asked the students to upload a pen and paper sketch to the board as a picture to identify possible problems early on. By doing this introduction session, we were sure everything keeps working well when a large number of people are making changes to the board at the same time.
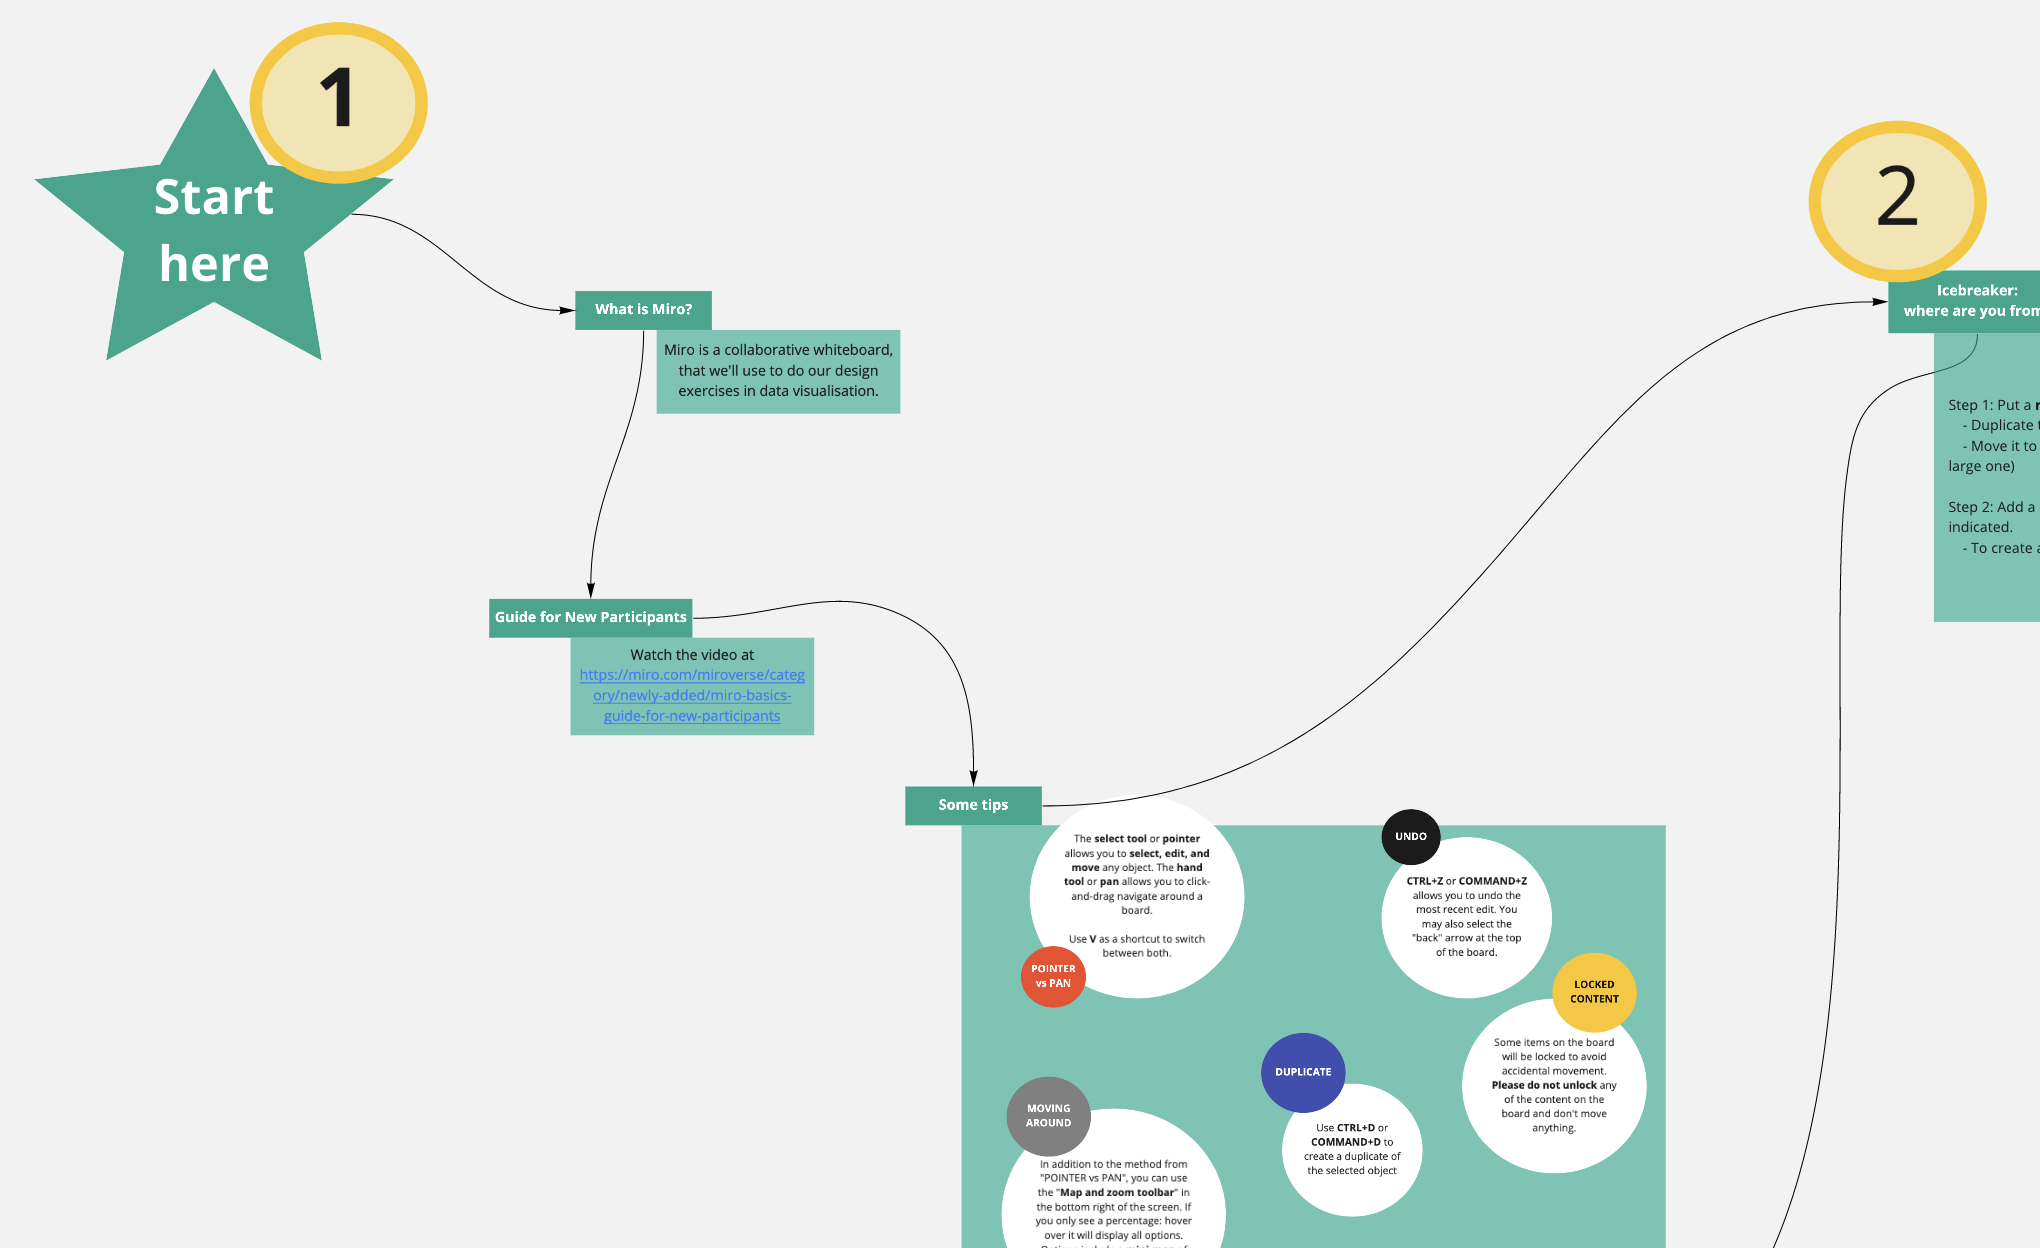 Part of the “How to work with miro” board, available at https://bit.ly/how-to-work-with-miro.
Design session-specific boards
Because of the large number of students in the course, three parallel collaboration boards were prepared, each managed by one teaching assistant. Within each board, different sections were created per group of four students. Each section was numbered corresponding to a table in the communication platform. Different areas were created which would guide the consecutive parts (warm-up, and diverge-emerge-converge) of the visual design exercise. A template can be found at https://bit.ly/miro-visual-design.
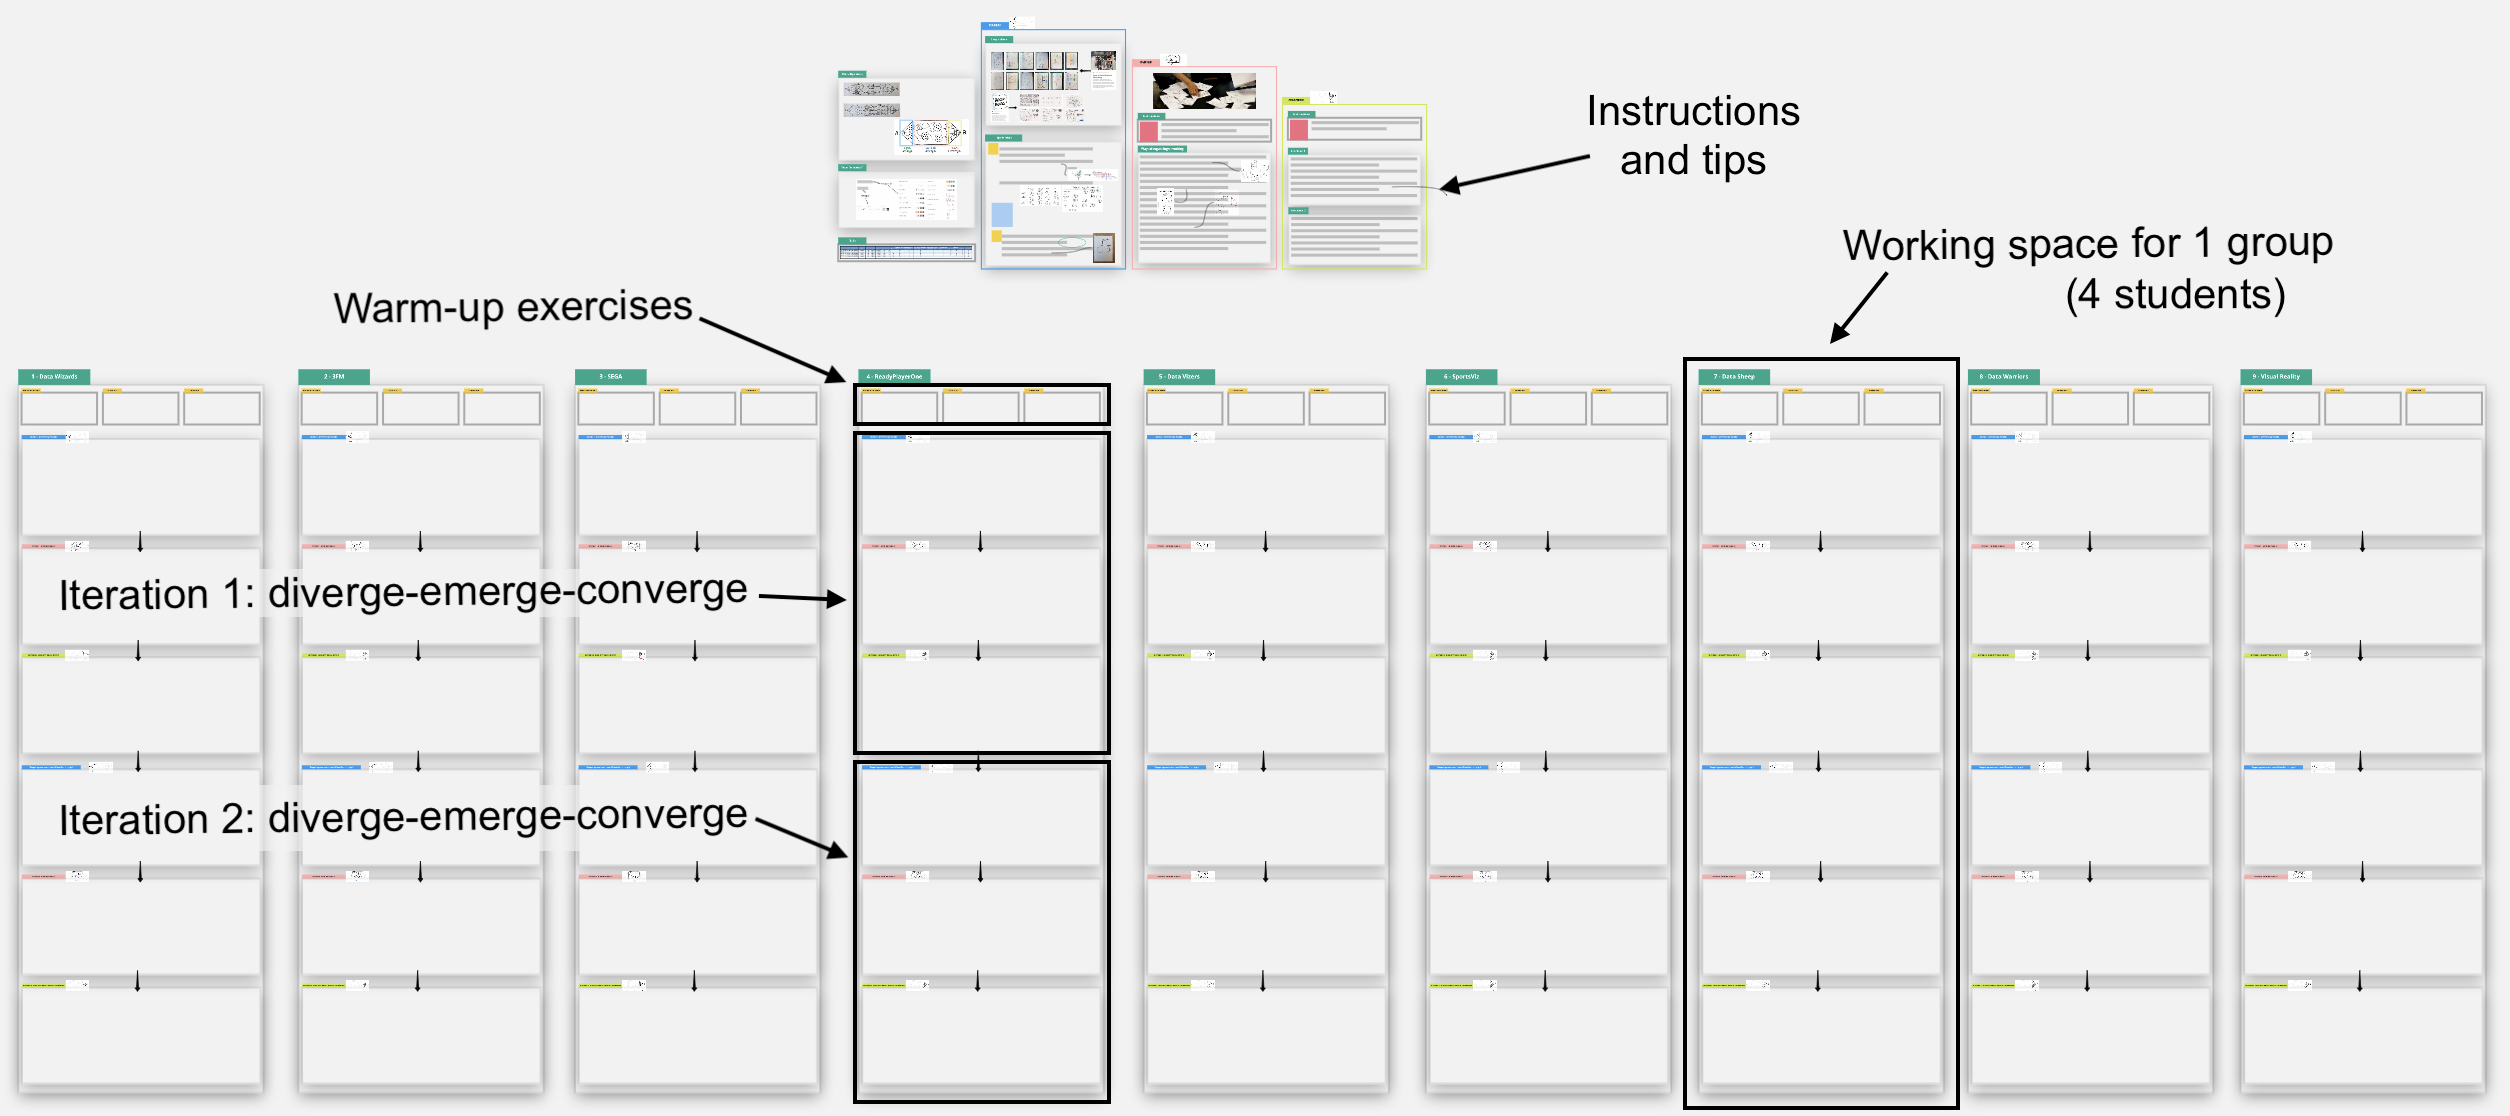 Overview of the miro board used for the design exercise. See https://bit.ly/miro-visual-design to zoom in.
Running the design session itself
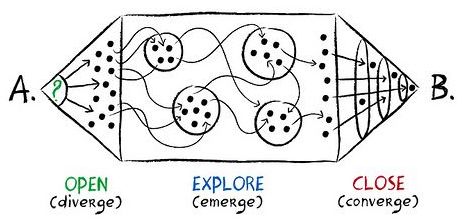
The students are introduced to the general concepts and the idea of diverge-emerge-converge (or open-explore-close; [Gray, Brown, Macanufo., 2010]). This is followed by warm-up exercises, and two iterations of diverge-emerge-converge. A detailed overview of the instructions and information provided to the students can be found in the ‘Design Session (template)’ miro board, and in the subsections below.
Warm up
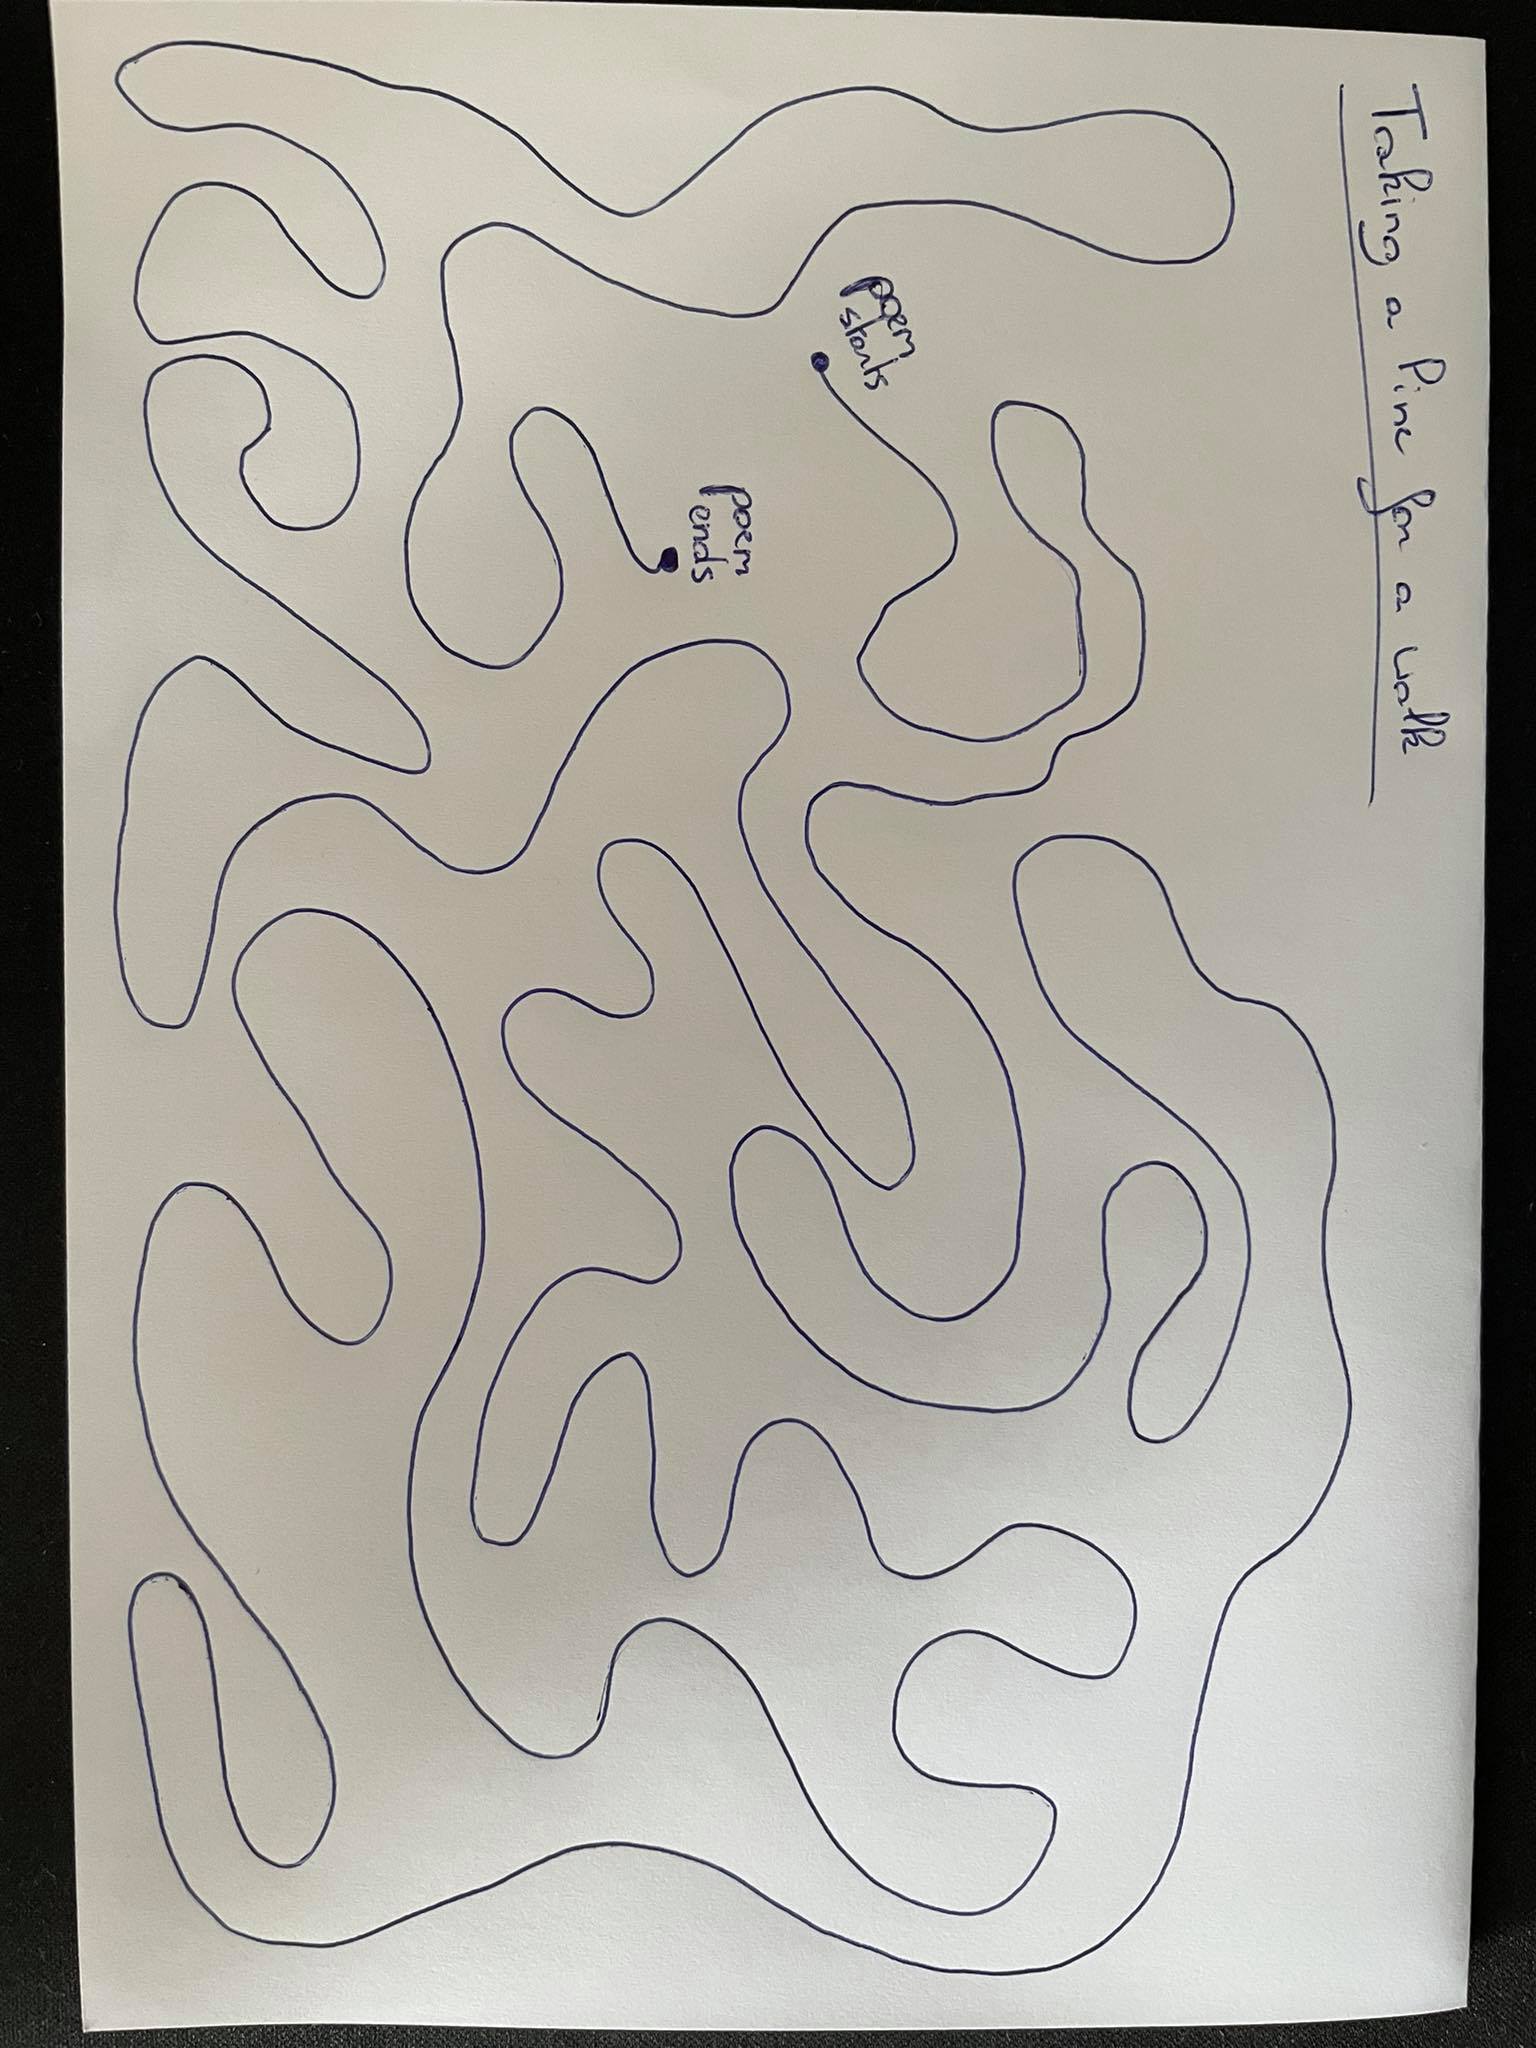
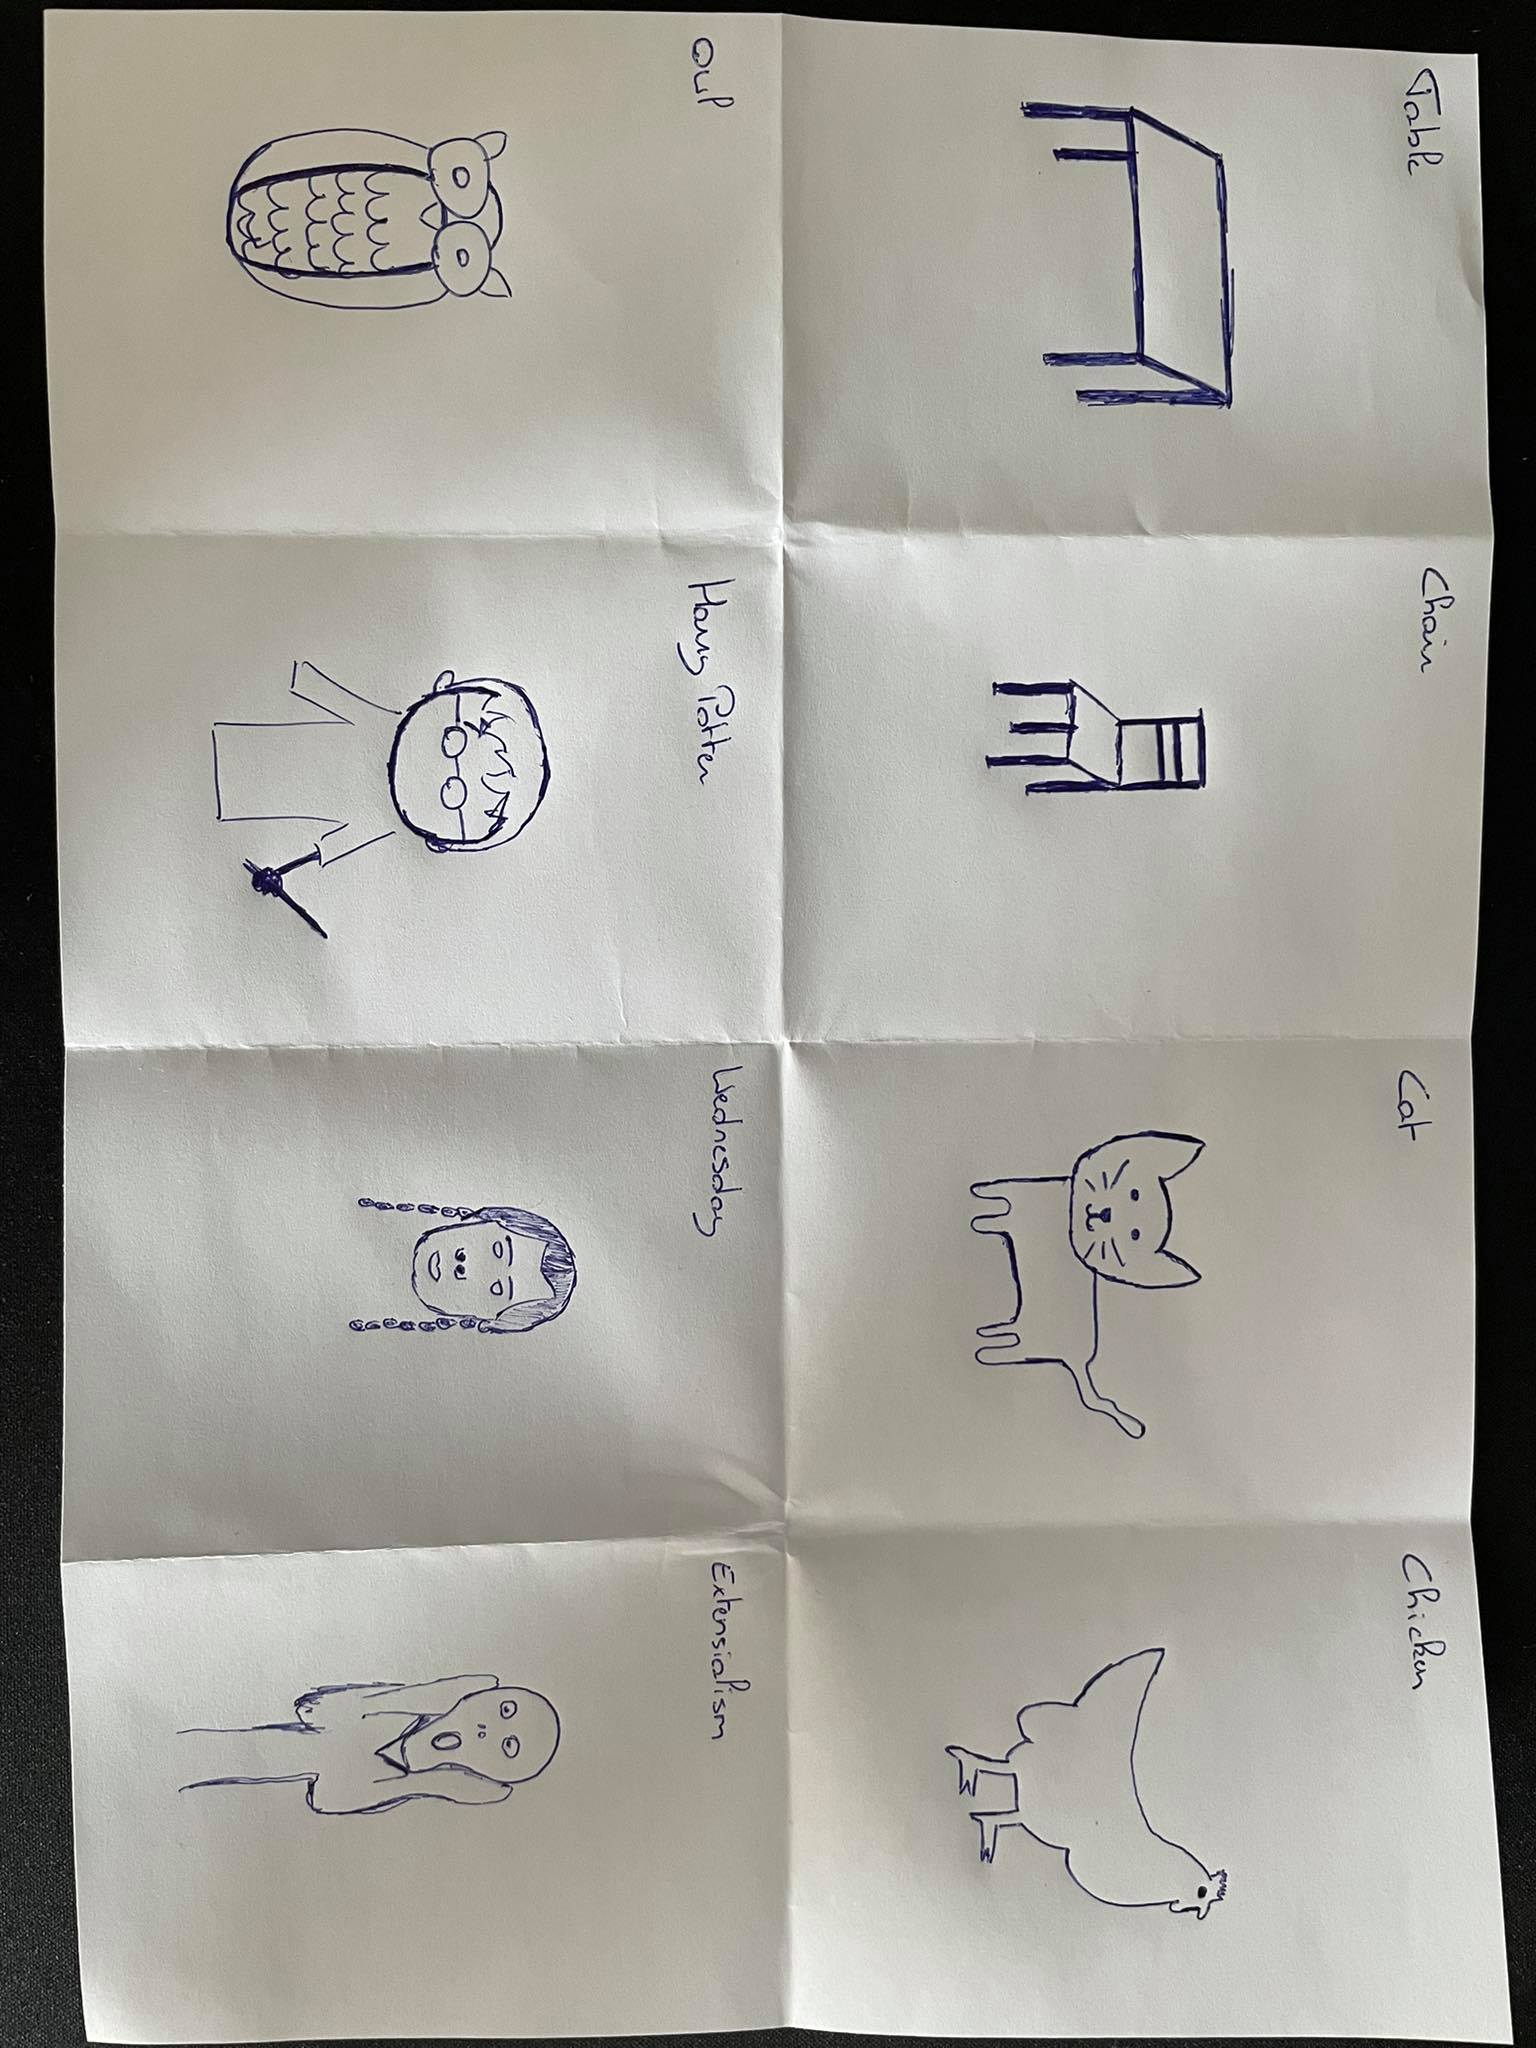
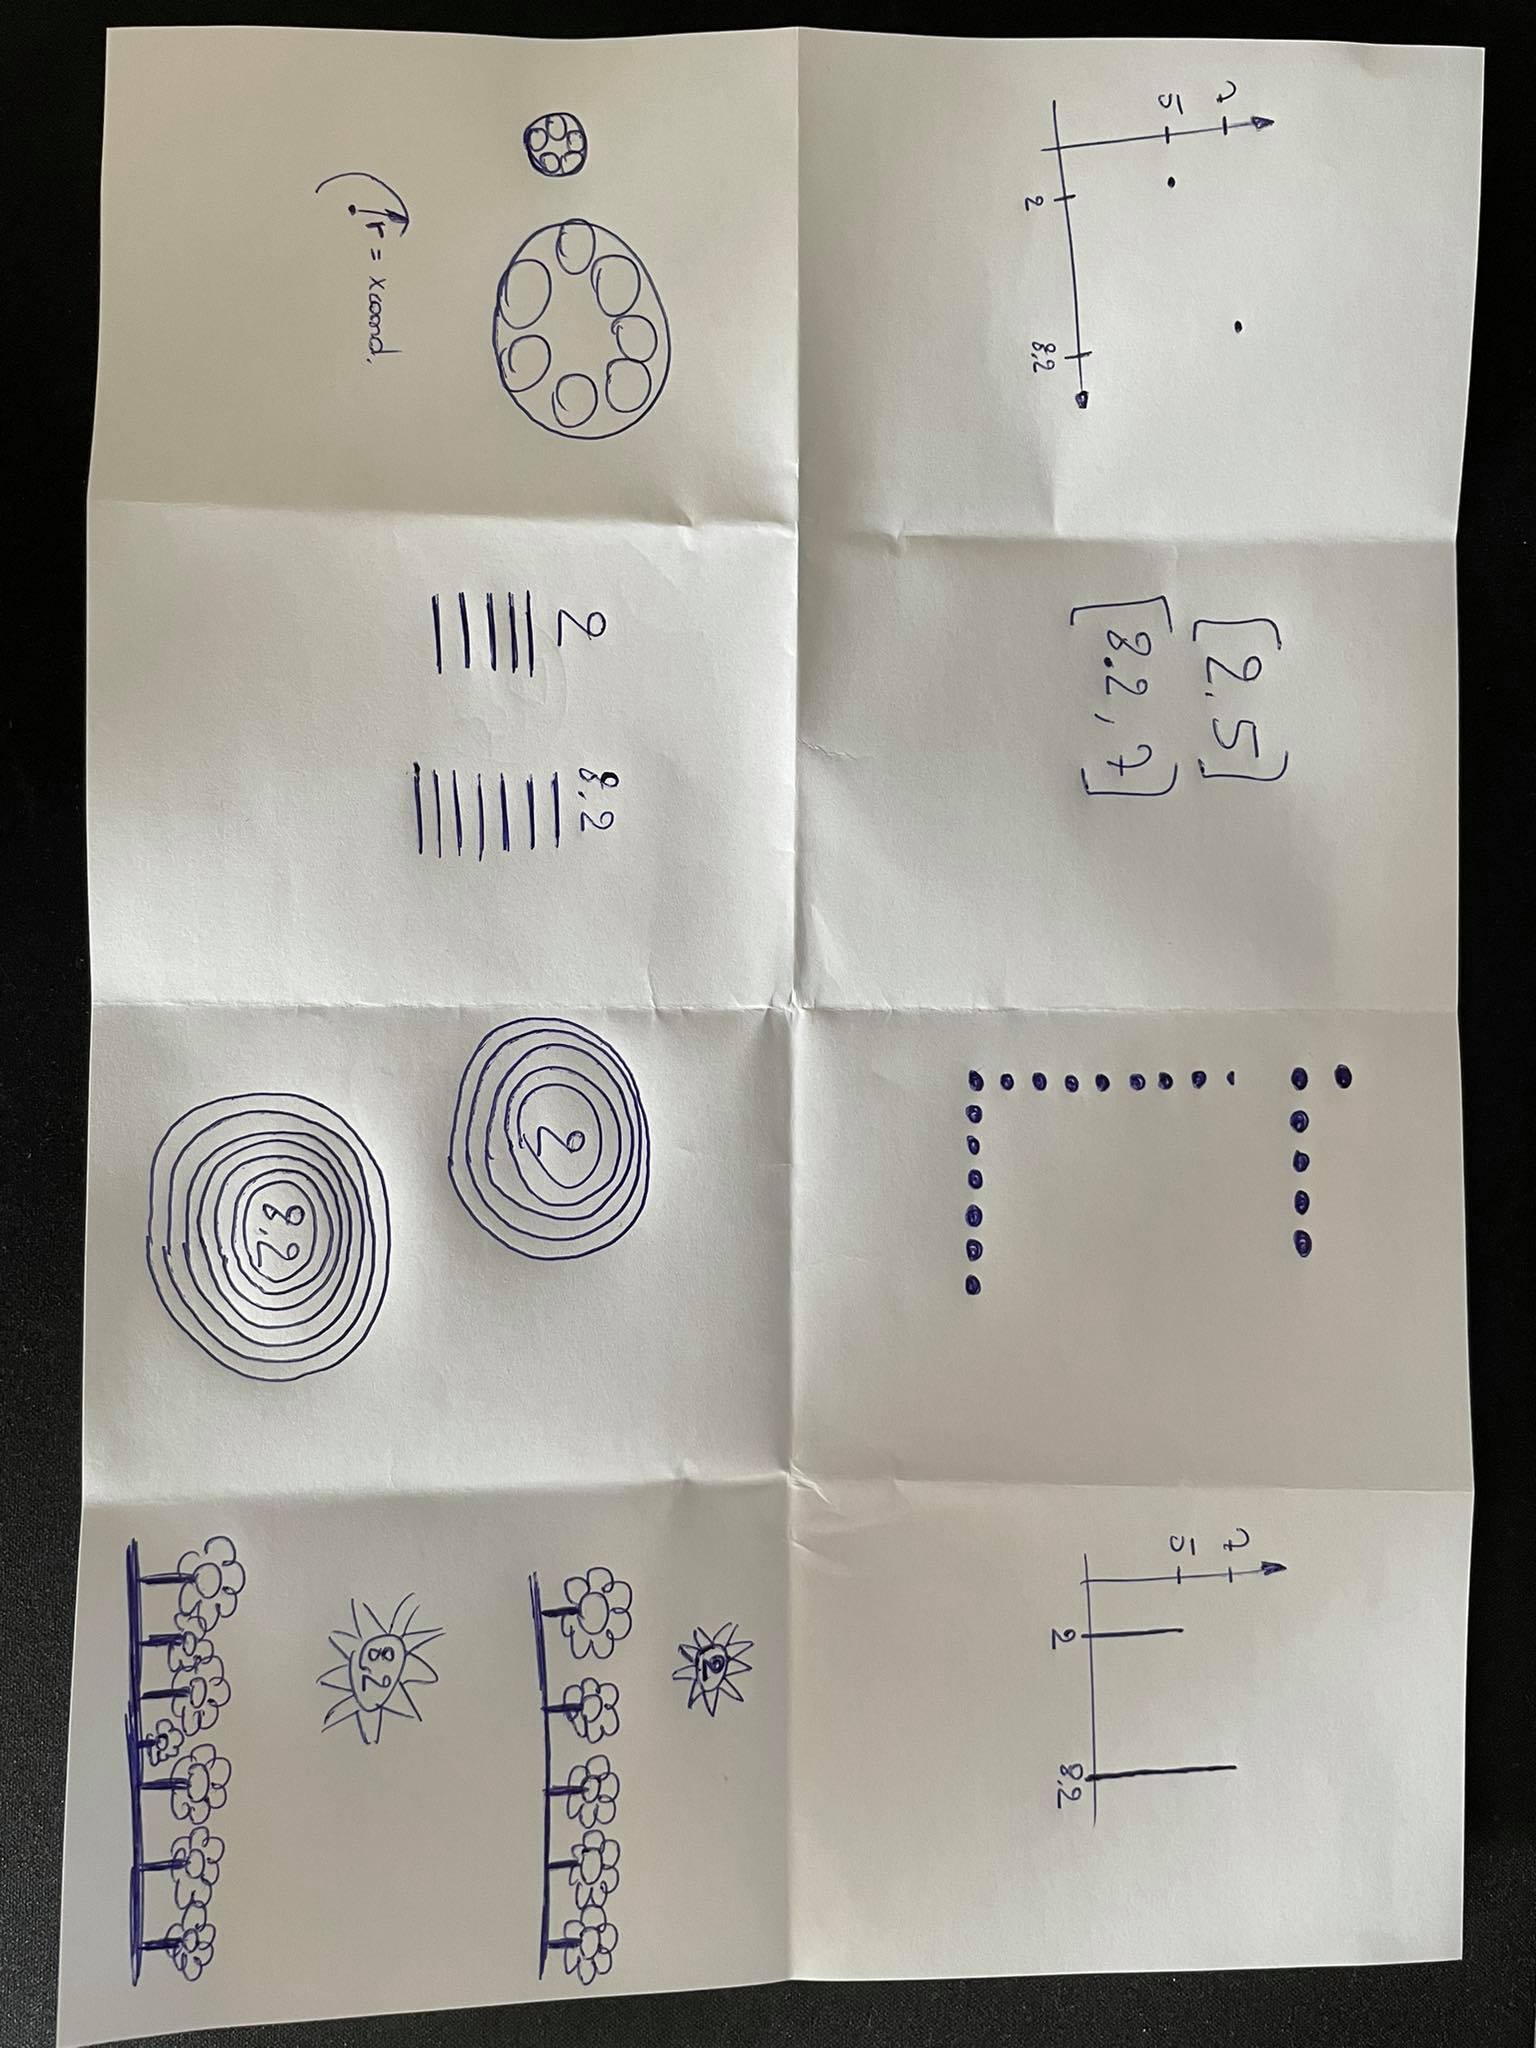
The warm-up exercises acted as a way to get the students familiar with their working material, to put them at ease for a type of workshop that they were not used to, and to test if taking pictures and uploading worked well; all in a fun setting. Exercises consist of (a) “taking a line for a walk” where students draw a single line while a poem is recited by the lecturer, (b) drawing eight concepts of increasing complexity in three seconds each, ranging from “table” and “chair”, to “Wednesday” and “existentialism”, and (c) drawing two data points in eight different ways.
Diverge
The primary purpose of the divergent phase is to create the raw material that can be combined, modified, or discarded later. Students are given thirty minutes to individually create as broad a range of sketches as possible for a given dataset. Sketches are drawn on A7-sized paper, marked with the student’s initials and a unique identifier, and a clear indication of what the sketch represents. Sketches are meant to convey the idea, not be polished drawings. Therefore a sketch should only take seconds to create. Different methods are used in concert to help in ideation. First, we provide an inspiration board with more than fifty creative datasketches, including work by Duncan Geere (blog.duncangeere.com/tag/sketchbook-pages/) and the Dear Data project (www.dear-data.com). Second, students are asked to think about reworking existing visuals (e.g., “how can Icreate a different version of a line chart”), to glue dissimilar ideas together (e.g., using a node-link diagram to draw geospatial data), or to reverse an idea (e.g., representing data points as links and relationships as nodes in a node-link diagram, as in [Longabaugh., 2012]). Students are specifically asked to suspend critical thinking at this stage which would lead to rejection of sketch ideas, as even “bad” sketches might be useful during the later stages, or at least help to map out design space.
As some students are overwhelmed with the range of possibilities for sketching and get stuck as a result of overchoice, we also present them with a way to structure their sketches using two conceptual matrices (see Figure 4). In one matrix, the columns represent the different dimensions in the dataset, whereas the rows represent the number of observations depicted in one visual (i.e. “one”, “a selection” or “all”). The student can randomly pick a cell in this matrix (e.g., fora dataset on COVID-19, drawing the number of reported infections on a single day, all Mondays, or all days of the last month) and create a sketch for that particular combination. In addition, a second matrix lists the different dimensions both as columns and as rows. Using this matrix as a guide, the student can, for example, focus on drawing infections by city, or tests versus infections. It is made clear that the rows are the base of the sketch, so that, for example, number of tests by virus strain is not the same as virus strain by number of tests.
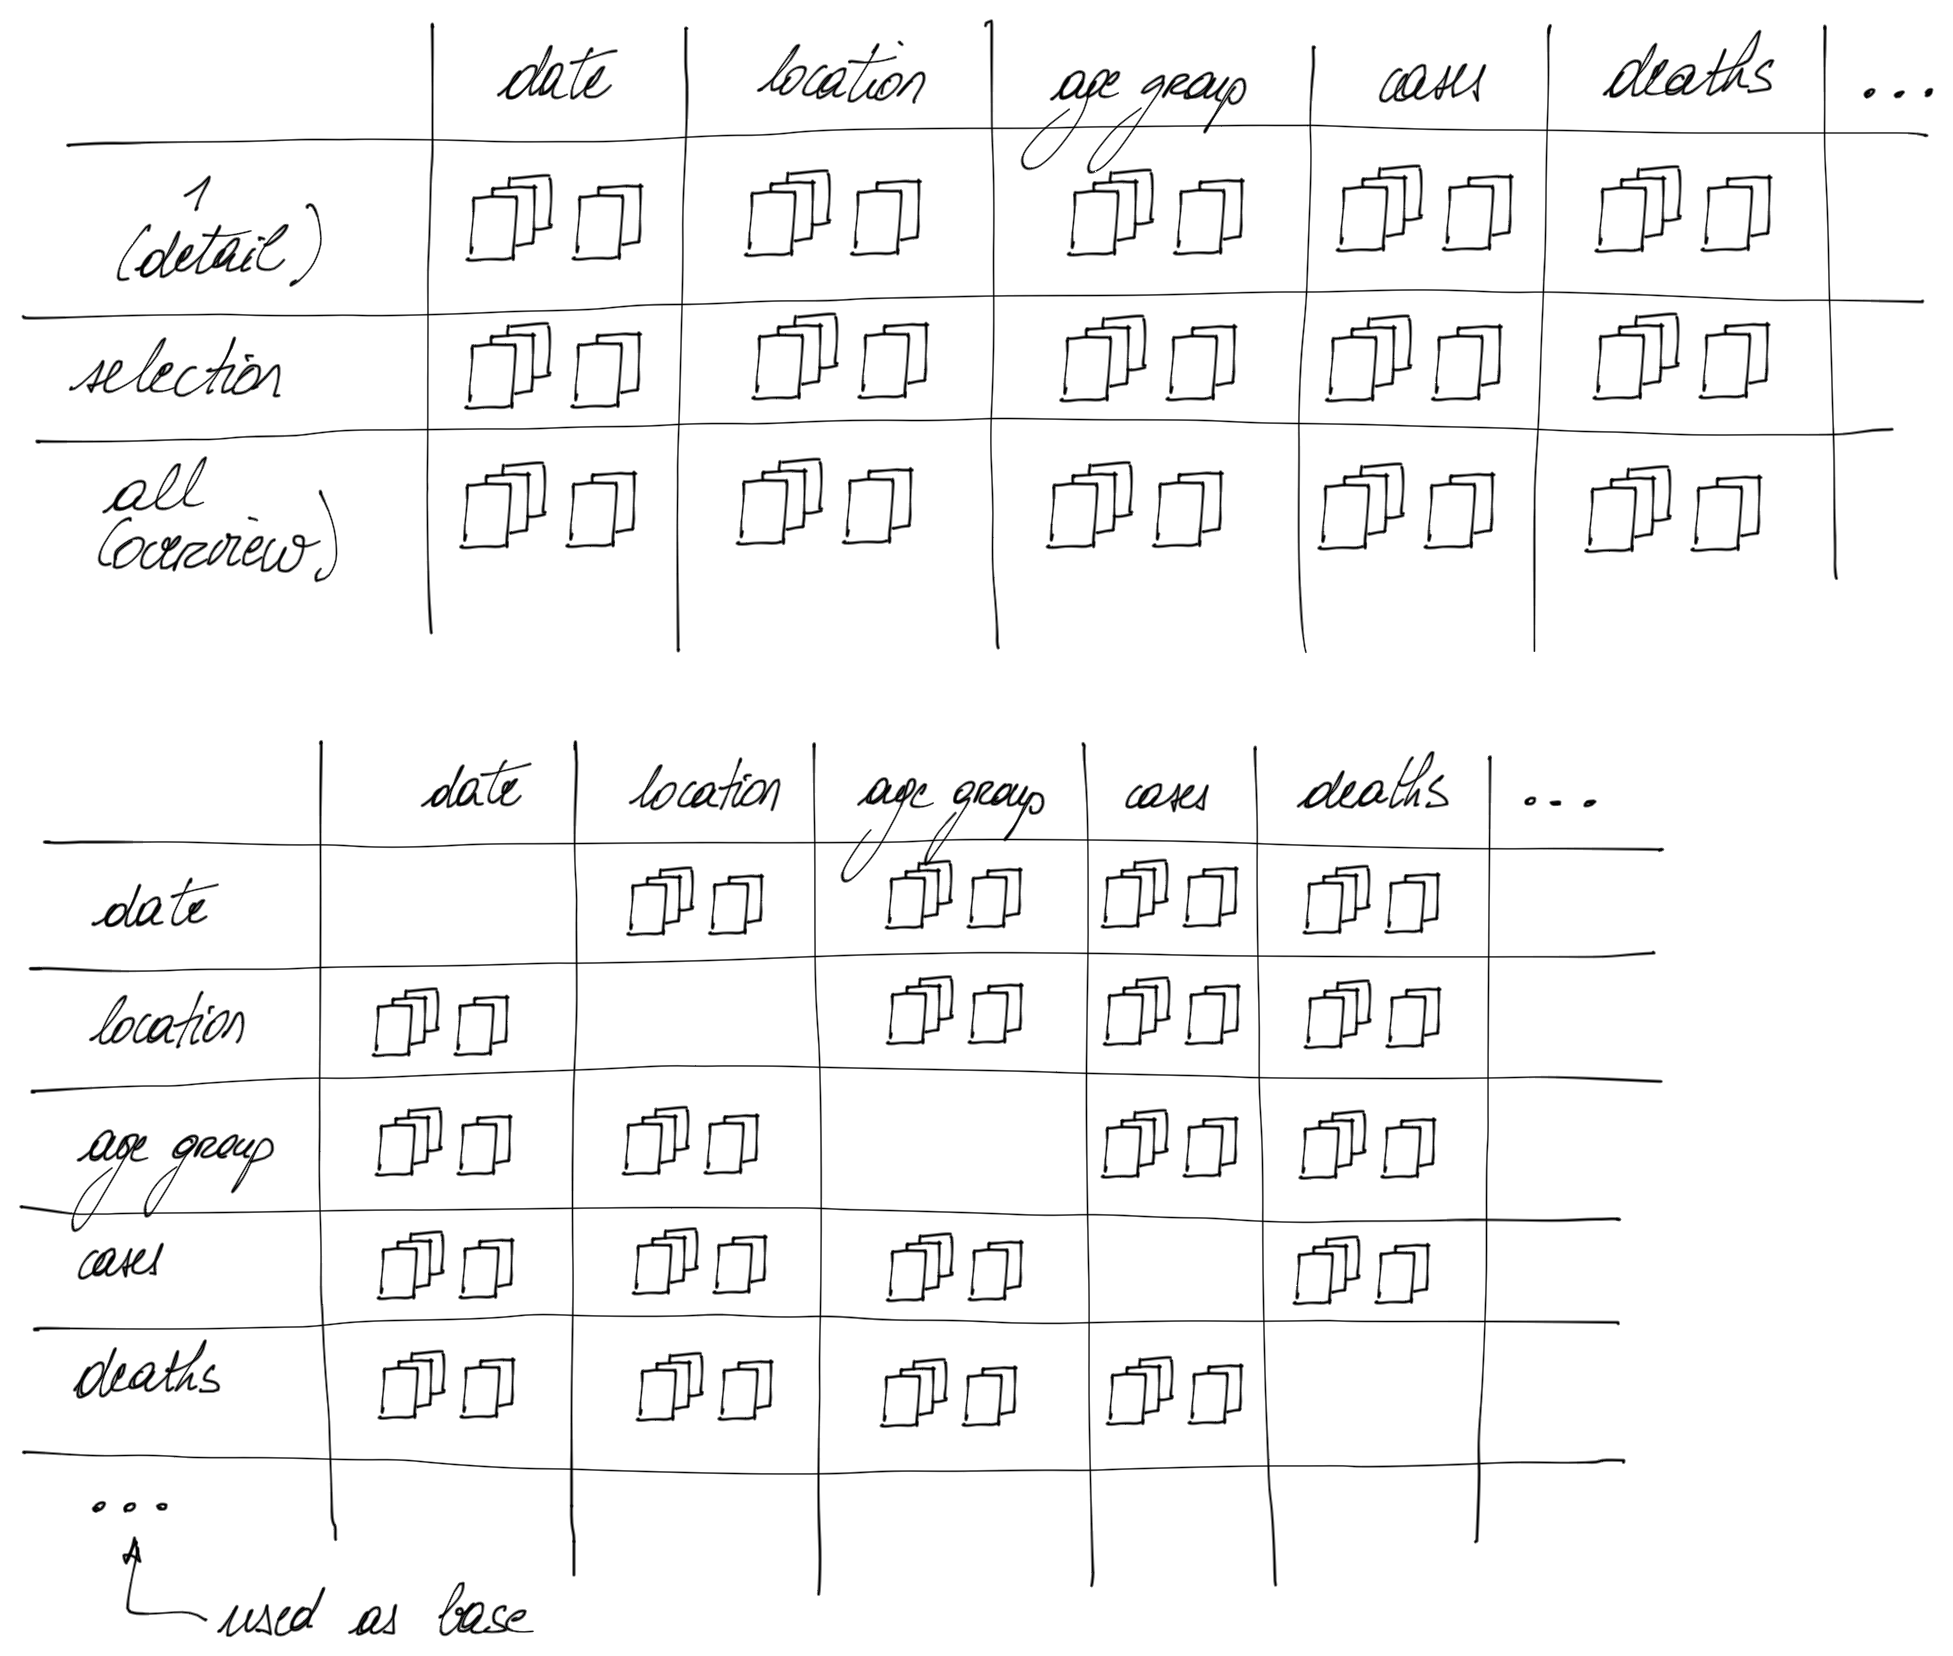
Figure 4: Conceptual matrices. In the top matrix, columns represent the different dimensions in the data set whereas rows represent the number of observations depicted in one visual (i.e. “one”, “a selection” or “all”). The bottom matrix lists the different dimensions both as columns and as rows. Students can use these matrices as guidance to create sketches that fit inside these cells.
Emerge
For the emerge stage, students are asked to discuss the generated sketches in small groups. They performed affinity mapping [Gray, Brown, Macanufo., 2010] to identify which sketches have a similar intent, followed by identifying which sketches could act as detailed views for other sketches (e.g., one sketch showing the total number of COVID-19 hospitalizations over a whole year, whereas another presenting a breakdown of the hospitalizations per city), and the SCAMPER framework [Eberle., 1972]: Substitute, Combine, Adapt, Modify, Put to another use, Eliminate, Reverse. Also, they are asked to consider which external data would be interesting to collect and combine with the data they already have.
This collaborative emergent phase is sched-uled for approximately 30 minutes.
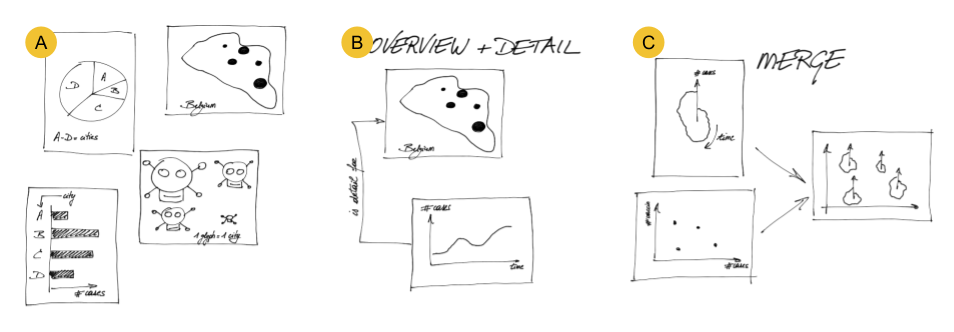
Figure 5: Explorations suggested to the students in the Emerge phase. [A] Make an affinity map: organizesketches based on the intent that they have; [B] Link sketches together where one provides an overview atlower resolution and the other goes into detail; [C] Merge different sketches into one.
Converge
Finally, in the convergent stage, students are asked to identify interesting ideas to work out further. To support them, we suggest looking at which are new, useful, and feasible (NUF framework [Gray, Brown, Macanufo., 2010]), and performing value mapping in which each student receives several voting tokens that they can put on those ideas that they find most interesting [Gray, Brown, Macanufo., 2010]. We emphasize that the technical implementation later in the course should not be a constraint in the first iteration, and that the design section of their final project is graded separately from the implementations. In other words, the importance of the feasibility aspect in the NUF framework is downplayed, to ensure that the students do not limit their visual design based on limited programming experience.
Quantitative results
All efforts when creating this setup were directed towards making it work and no specific attention was given to measuring the output quantitatively. More specifically, how many sketches each student generated at each stage, how different these sketches were, how many were combined during the emerge and converge phases, etc. The main issues when quantifying these were related to the fact that everything was fluid (as students could use sketches from other groups, and sometimes even switched groups), not all sketches were uniquely identifiable and linked to a specific student, and there may have been sketches that the students created that were not uploaded into miro. This means that any count has to be taken with a large grain of salt and no conclusions should be drawn from this. Nevertheless and for completeness, the number of sketches per student and group as extracted from the miro boards can be found at https://bit.ly/visual-design-quantitative. On average, students created 6 sketches, with the more prolific students generating up to 16.
References
- William JR Longabaugh. Combing the hairball with biofabric: a new approach for visualization of largenetworks. BMC bioinformatics, 13(1):1–16, 2012.
- Dave Gray, Sunni Brown, and James Macanufo. Gamestorming: A playbook for innovators, rulebreakers, and changemakers. ” O’Reilly Media, Inc.”, 2010
- Robert F Eberle. Developing imagination through scamper. Journal of Creative Behavior, 1972