Linked views in paper.js
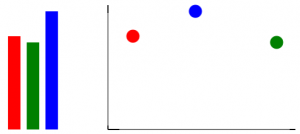
Trying out paper.js. For future reference: here’s a (naive) example of doing linked views. Hovering over a red object will make all red objects yellow, and the same goes for blue and green. The trick used here is to use the data property of the visual mark (i.c. bar and point), and adding an itemId to it. See http://paperjs.org/reference/item/#data for more information on that property.
In the example below, I did use both strokeColor and fillColor for the bars (which are actually lines) and the circles. This is to not have to find out which has to be changed to yellow; I’m just doing both.
See http://github.com/jandot/playing-with-paperjs for updates.
var data = [
  {name: "A", x: 40, y: 150, color: "red"},
  {name: "B", x: 270, y: 140, color: "green"},
  {name: "C", x: 140, y: 190, color: "blue"}]

// The barchart
function enter(event) {
  var allItemsWithId = [this];
  for ( var i = 0; i < project.activeLayer.children.length; i++ ) {
    if ( project.activeLayer.children[i].data.itemId == this.data.itemId ) {
      allItemsWithId.push(project.activeLayer.children[i]);
    }
  }
  for (var i = 0; i < allItemsWithId.length; i++ ) {
    allItemsWithId[i].fillColor = 'yellow';
    allItemsWithId[i].strokeColor = 'yellow';
  }
}

function leave(event) {
  var allItemsWithId = [this];
  for ( var i = 0; i < project.activeLayer.children.length; i++ ) {
    if ( project.activeLayer.children[i].data.itemId == this.data.itemId ) {
      allItemsWithId.push(project.activeLayer.children[i]);
    }
  }
  for (var i = 0; i < allItemsWithId.length; i++ ) {
    allItemsWithId[i].fillColor = this.data.color;
    allItemsWithId[i].strokeColor = this.data.color;
  }
}

for (var i = 0; i < data.length; i++ ) {
  var bar = new Path();
  bar.name = "bar_" + data[i].name;
  bar.add(new Point(50+i*30,250));
  bar.add(new Point(50+i*30, 250-data[i].y));
  bar.strokeWidth = 20;
  bar.onMouseEnter = enter;
  bar.onMouseLeave = leave;

  bar.data.itemId = data[i].name; // We'll use this to match different marks for the same item

  bar.strokeColor = data[i].color;
  bar.fillColor = data[i].color;
  bar.data.color = data[i].color; // item.data can contain arbitrary data, necessary for use in enter() and leave()
}

// The scatterplot
var xAxis = new Path();
xAxis.add(new Point(200, 250));
xAxis.add(new Point(500, 250));
xAxis.strokeWidth = 1;
xAxis.strokeColor = 'black';
var yAxis = new Path();
yAxis.add(new Point(200, 50));
yAxis.add(new Point(200, 250));
yAxis.strokeWidth = 1;
yAxis.strokeColor = 'black';
for (var i = 0; i < data.length; i++ ) {
  var point = new Path.Circle(new Point(200+data[i].x, 250-data[i].y),10);
  point.name = "point_" + data[i].name;
  point.onMouseEnter = enter;
  point.onMouseLeave = leave;

  point.data.itemId = data[i].name; // We'll use this to match different marks for the same item

  point.strokeColor = data[i].color;
  point.fillColor = data[i].color;
  point.data.color = data[i].color; // item.data can contain arbitrary data, necessary for use in enter() and leave()
}