Resources
:: Public datasets ::
- Yelp Open Dataset <= Used in some of our courses
- Google Dataset Search
- Open Care Data
- List of datasets through Data Science Central
- Location-based social networking data
- Data from CERN
- Patient record data (need registration and passing test)
- List of datasets in different categories by Microsoft
- Network data: incl Panama papers, Russion twitter trolls, Trumpworld, …
- Social contact data
- Network of intellectual cooperation
- Data for Climate Action D4CA
- Cool Datasets
- Armed Conflict Location & Event Data Project (ACLED)
- Stanford Large Network Dataset Collection
- List by Motaz Saad
- Journey of Analytics
- Harvard Dataverse
- Commercial Energy Load US
- AWS Open Data
- UC Berkeley Agricultural & Resource Economics
- Nature Scientific Data
- Agriculture Datasets at data.world
- FoodData Central: an “integrated data system that provides expanded nutrient profile data and links to related agricultural and experimental research”
- Data from the paper “Topological data analysis reveals a core gene expression backbone that defines form and function across flowering plants” Palande et al, 2023 https://doi.org/10.1371/journal.pbio.3002397
- Human population maps (at high resolution) from Kontur
- FLAVIA: Images of leafs for classification
- Naturalis biodiversity data
- AgBioData datasets: agricultural biological databases involved with the AgBioData consortium
:: Visualization resources ::
Note: if you know of other interesting blogs or resources regarding data visualisation and/or visual design, do let me know.
- Shirley Wu has great visuals as well as explanations thereof. She also is co-author of the Data Sketches book where she explains the process of creating specific visuals including the data pre-processing and iterations of visual design.
- InformationIsBeautiful by David McCandless.
- Flowing Data by Nathan Yau, author of the books “Visualize This: The FlowingData Guide to Design, Visualization, and Statistics” and “Data Points: Visualization That Means Something”
- The Catalogue of Data Visualisation Tools by Andy Kirk, author of the book “Data Visualisation: A Handbook for Data Driven Design”
- Martin Krzywinski’s website is a good source of inspiration. Martin is the developer of Circos and the Hiveplot, and has a very good handle on creating the best visual designs for a given task.
- Bret Victor has interesting writings on his website, including the Ladder of Abstraction, Explorable Explanations and Scientific Communication as Sequential Art
- For examples of what not to do, see viz.wtf.
Visual encoding overviews
These are websites that provide a comprehensive list of approaches for visualising a certain type of information.

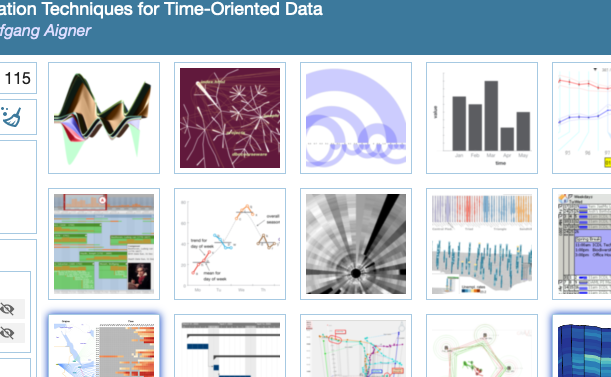
- Time: https://vcg.informatik.uni-rostock.de/~ct/timeviz/timeviz.html
- Uncertainty: https://namastevis.github.io/uncertaintyVizBrowser/
- Trees: https://treevis.net/
- Text: https://textvis.lnu.se/
- Trust (in ML): https://trustmlvis.lnu.se/
- VA and Embeddings: https://va-embeddings-browser.ivis.itn.liu.se/
- dataviz.cafe: https://dataviz.cafe/
Interesting talks
- Ben Fry on the principles of data visualization
- Miriah Meyer’s TEDx talk on biological data visualization
- Jeff Heer dataviz introduction
- Mike Bostock “Design = search problem”
- Kim Albrecht Untangling tennis
- Bret Victor Inventing on Principle
- Bret Victor Interactive Exploration of a Dynamical System
- Bret Victor Blindly Manipulating Symbols
- James Bednar Visualize any Data Easily, from Notebooks to Dashboards :: Scipy 2019 Tutorial
Conferences
- biovis: http://biovis.net/2024/
- IEEE VIS: https://ieeevis.org
- EuroVis: https://eurovis.org
- VCBM: https://dblp.org/db/conf/vcbm/index.html
- International Symposium on Graph Drawing: http://graphdrawing.org/
Tools
- Svelte - General framework for creating web content and visuals
- D3 - Javascript visualisation library
- P5 - Another javascript visualisation library
- OpenProcessing - classroom platform for teaching P5
- Quil - clojure implementation of P5
:: Our own teaching material ::
- Data visualisation:
- Topological Data Analysis
- My talk at the ICG Lab Series: https://www.youtube.com/watch?v=rMAbW48k-Yk&ab_channel=JKUCG