Creating a map in D3
This walkthrough is based on Mike Bostock’s Let’s Make a Map http://bost.ocks.org/mike/map/ but now specifically adapted to display a map of Belgium with the provinces. Although large parts are the same, their are some alterations to repair minor errors that I ran into while creating the map for Belgium.
Getting the data
First, we need to find a map of Belgium and the provinces. A great resource to find maps of all sorts from over the world is Natural Earth. In their download section you can find the files:
- Admin 0 - Subunits (scale 1:10m)
- Admin 1 - States, Provinces (scale 1:10m)
As both these files contain data from the entire world, we will have to select the parts about Belgium.
Installing the tools
Because we will be using D3 and TopoJSON to create the map, first you have to make sure that all necessary tools are installed. As you probably already have D3 installed, I’ll only cover the installation of the tools needed to handle the geographic location files. The ogr2ogr binary that we will need to use in order manipulate the files we downloaded from Natural Earth is included with the Geospatial Data Abstraction Library (GDAL). Installation on Mac is really simple:
brew install gdal
Next we need to install Node.js as the reference implementation of TopoJSON requires this. You can download an installer for Mac at https://nodejs.org/download/.
Finally, we can install TopoJSON:
npm install -g topojson
Creating the data set
As we now have the raw data and the necessary tools installed, we can create the data file that will hold only the information we need. We first start by filtering out the BE features that we need from the original shapefile (.shp). Next, we have to convert this to an intermediate GeoJSON file before we can finally generate the TopoJSON file.
TopoJSON is an extension of GeoJSON that encodes topology and is usually much smaller than GeoJSON. The original map’s GeoJSON is 50,531 bytes large, the province map is 93,240 bytes but the final combined TopoJSON file is only 12,669 bytes large. In addition, with TopoJSON files you can automatically compute the boundary lines and/or other interesting applications without requiring additional storage.
So, the first step is creating the GeoJSON file from the shape file ne_10m_admin_0_map_subunits.shp. We do this with ogr2ogr:
ogr2ogr \
  -f GeoJSON \
  -where "ADM0_A3 = 'BEL' " \
  subunits.json \
  ne_10m_admin_0_map_subunits.shp
To know which field you have to select here, you can have a look in the OpenDocument file ne_10m_admin_0_map_subunits.dbf that is also included in the download. In this case ADM0 refers to Admin 0, the highest level administrative boundaries and A3 refers to the ISO 3166 country code defined by 3 characters.
The next step is to get the information for all Belgian provinces. To do this run the following command:
ogr2ogr \
  -f GeoJSON \
  -where "iso_3166_2 = 'BE-'" \
  provinces.json \
  ne_10m_admin_1_states_provinces.shp
As you can see, we are now filtering on a different field that we identified in the accompanying OpenDocument file.
The last step is to combine these files (subunits.json and provinces.json) into one big file called belprov.json. As we will need id fiels for both files, we do this in two steps. In the first step we create a TopoJSON file for the provinces and take field adm1_cod_1 as the id:
topojson \
  -o provincesTopo.json \
  --id-property adm1_cod_1 \
  --properties name=NAME \
  provinces.json
In a second step we do the same for the subunits but now take the field SU_A3 as the id:
topojson \
  -o subunitsTopo.json \
  --id-property SU_A3 \
  --properties name=NAME \
  subunits.json
And finally we combine the two files:
topojson \
  -o belprov.json \
  --id-property SU_A3 \
  --properties name=NAME \
  -- \
  subunitsTopo.json \
  provincesTopo.json
Ogr2ogr has many more features that I didn’t cover here but you can always look at the relevant documentation to find out more.
Creating the web page
In order to create the map, we start from the following html file. The belprov.json that we created in the previous step should be located in the same directory. In this example we also assume that d3.js is located in a subfolder called d3. Alternatively you could also create a web reference for d3.js.
<!DOCTYPE html>
<html lang="en">
    <head>
        <meta charset="utf-8">
        <title>Map building</title>
        <script type="text/javascript" src="d3/d3.js"></script>
        <script src="http://d3js.org/topojson.v1.min.js"></script>
        <style type="text/css">
                /*No style rules yet*/
        </style>
    </head>
    <body>
        <script type="text/javascript">
                /*No script here yet*/
        </script>
    </body>
</html>
When you load this html file you will only get an empty screen. Therefore you have to replace the /No script here yet/ with the following code:
d3.json("belprov.json", function(error, be) {
  if (error) return console.error(error);
  console.log(be);
});
When you load the index.html and look at the console in the browser you will see a topology object that contains the boundaries of Belgium and the provinces. Now let’s do something with this object so that we can draw a map.
Drawing the country map
The first step is to create the root SVG element and as Belgium is wider than it is high, we choose the width and height accordingly:
var width = 1160;
var height = 960;
var svg = d3.select("body").append("svg")
    .attr("width", width)
    .attr("height", height);
In order to draw the map, we need a projection and a path generator. In this case we will use an Albers projection which is a conic, equal area map projection that uses two standard parallels.
var projection = d3.geo.albers()
    .center([0, 50.64])
    .rotate([-4.668, 0])
    .parallels([51.74, 49.34])
    .translate([width / 2, height / 2]);
When looking at these numbers you have to keep in mind that the center of Belgium is located at the geographical coordinates 50.641111, 4.668056 and that the north-most point is at 51.505139 degrees and the south-most point at 49.497 degrees. Knowing this, you can see that the center of the map is set at 50.64 while the map is rotated by 4.668 to the east (hence the negative). By doing this we make sure that the map is rotated and centered on the center point of Belgium. The parallels have to enclose the map so we took the parallels a bit north and a bit south of Belgium.
Next, we also need the path generator:
var path = d3.geo.path()
    .projection(projection);
In order to draw the map, we still have to append the path element:
svg.append("path")
    .datum(topojson.feature(be, be.objects.subunits))
    .attr("d", path);
So the complete code now looks like:
<!DOCTYPE html>
<html lang="en">
    <head>
        <meta charset="utf-8">
        <title>Map building</title>
        <script type="text/javascript" src="d3/d3.js"></script>
        <script src="http://d3js.org/topojson.v1.min.js"></script>
        <style type="text/css">
                /*No style rules yet*/
        </style>
    </head>
    <body>
        <script type="text/javascript">
        var width = 1160;
        var height = 960;

        var projection = d3.geo.albers()
            .center(center)
            .rotate(rotate)
            .parallels(parallels)
            .translate(offset);

        var path = d3.geo.path()
            .projection(projection);

        var svg = d3.select("body").append("svg")
            .attr("width", width)
            .attr("height", height);

        d3.json("belprov.json", function(error, be) {
            if (error) return console.error(error);

            svg.append("path")
                .datum(topojson.feature(be, be.objects.subunits))
                .attr("d", path);
        });
        </script>
    </body>
</html>
Running this code will lead to the following map drawn in the browser:
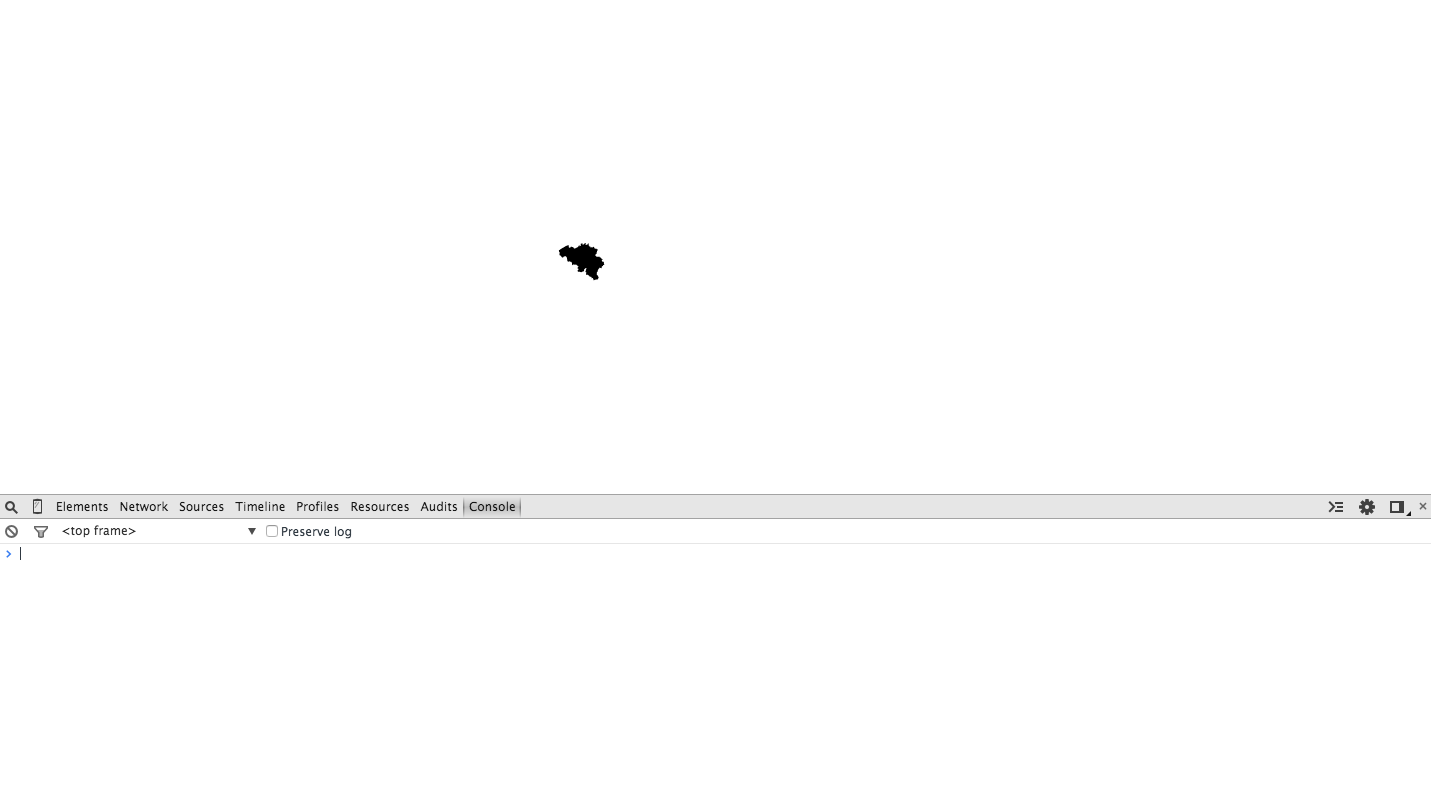
As you can see there is only a very small map of Belgium visible in the middle of the page. Of course this is not what we want. In order to make a bigger map, you can specify a scale when specifying the projection. However, doing this by hand means just going through a set of numbers by trial and error. Because we are using a TopoJSON object we can calculate the boundaries for the map and use those to recalculate the scale. Doing this will require some more code and we first start by moving the parameters for the projection into some variables:
var scale = 25000;
var offset = [width / 2, height / 2];
var center = [0, 50.64];
var rotate = [-4.668, 0];
var parallels = [51.74, 49.34];
Next, we create the projection with these parameters and recalculate them based on the boundaries that can be calculated by path.bounds(). This calculation is done in:
var bounds  = path.bounds(topojson.feature(be, be.objects.subunits));
var hscale  = scale*width  / (bounds[1][0] - bounds[0][0]);
var vscale  = scale*height / (bounds[1][1] - bounds[0][1]);
scale   = (hscale < vscale) ? hscale : vscale;
offset  = [width - (bounds[0][0] + bounds[1][0])/2,
        height - (bounds[0][1] + bounds[1][1])/2];
var centroid = d3.geo.centroid(topojson.feature(be, be.objects.subunits));
center = [0, centroid[1]];
rotate = [-centroid[0],0];
In this case, I already cheated a bit by defining a default scale of 25,000. When you take an initial value that is either too small or too big, clipping might occur near the edges due to some rounding errors. Outputting the recalculated scale after a random initial scale value (e.g. 150 which will lead to clipping) to the console will give you an idea on which number to use in a second run and avoid the clipping.
After you have calculated the new parameters you recreate the projection and draw the map again. The complete code is now:
<!DOCTYPE html>
<html lang="en">
    <head>
        <meta charset="utf-8">
        <title>Map building</title>
        <script type="text/javascript" src="d3/d3.js"></script>
        <script src="http://d3js.org/topojson.v1.min.js"></script>
        <style type="text/css">
                /*No style rules yet*/
        </style>
    </head>
    <body>
        <script type="text/javascript">
        var width = 1160;
        var height = 960;
        var scale = 25000;
        var offset = [width / 2, height / 2];
        var center = [0, 50.64];
        var rotate = [-4.668, 0];
        var parallels = [51.74, 49.34];

        var projection = d3.geo.albers()
            .center(center)
            .rotate(rotate)
            .parallels(parallels)
            .scale(scale)
            .translate(offset);

        var path = d3.geo.path()
            .projection(projection);

        var svg = d3.select("body").append("svg")
            .attr("width", width)
            .attr("height", height);

        d3.json("belprov.json", function(error, be) {
            if (error) return console.error(error);

            var bounds  = path.bounds(topojson.feature(be, be.objects.subunits));
            var hscale  = scale*width  / (bounds[1][0] - bounds[0][0]);
            var vscale  = scale*height / (bounds[1][1] - bounds[0][1]);
            scale   = (hscale < vscale) ? hscale : vscale;
            offset  = [width - (bounds[0][0] + bounds[1][0])/2,
                                height - (bounds[0][1] + bounds[1][1])/2];
            var centroid = d3.geo.centroid(topojson.feature(be, be.objects.subunits));
            center = [0, centroid[1]];
            rotate = [-centroid[0],0];

            projection = d3.geo.albers()
                .center(center)
                .rotate(rotate)
                .parallels(parallels)
                .scale(scale)
                .translate(offset);

            path = path.projection(projection);

            svg.append("path")
                .datum(topojson.feature(be, be.objects.subunits))
                .attr("d", path);
        });
        </script>
    </body>
</html>
Running this code will give you:
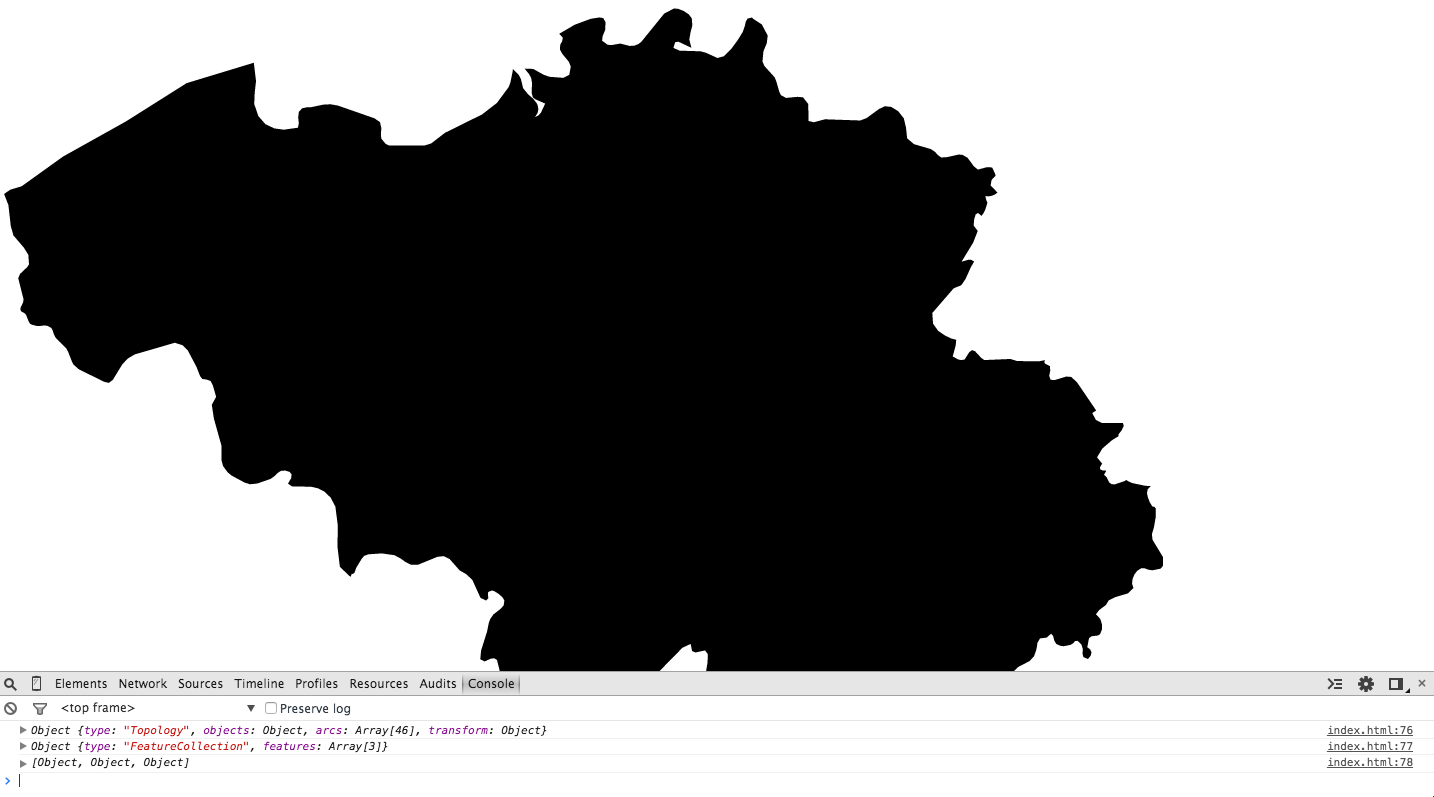
We now have a complete map of Belgium but this one is completely black and we would like to see the provinces.
Adding the provinces
Because we also have to provinces in our TopoJSON file, we can pull out the features array and create a path element for each feature which will again give you the complete map but now with the provinces:
svg.selectAll(".province")
    .data(topojson.feature(be, be.objects.provinces).features)
    .enter()
    .append("path")
    .attr("d", path);
Running this code will give you a map of Belgium again but now you can already see the provinces. As this map is completely black, we can also give each province a different color by defining a CSS style for each province and adding the attribute to the path. First we add the CSS style to the place where we had /No style rules yet/ in our html:
.province.BEL-2 { fill: #ccebc5; }
.province.BEL-3 { fill: #bc80bd; }
.province.BEL-3474 { fill: #d9d9d9; }
.province.BEL-3475 { fill: #fccde5; }
.province.BEL-3476 { fill: #b3de69; }
.province.BEL-3477 { fill: #fdb462; }
.province.BEL-3478 { fill: #80b1d3; }
.province.BEL-3479 { fill: #fb8072; }
.province.BEL-3480 { fill: #bebada; }
.province.BEL-3481 { fill: #ffffb3; }
.province.BEL-3482 { fill: #8dd3c7; }
Next we alter the code for the path to:
svg.selectAll(".province")
  .data(topojson.feature(be, be.objects.provinces).features)
  .enter()
  .append("path")
  .attr("class", function(d) { return "province " + d.id; })
  .attr("d", path);
This gives you the following complete code:
<!DOCTYPE html>
<html lang="en">
    <head>
        <meta charset="utf-8">
        <title>Map building</title>
        <script type="text/javascript" src="d3/d3.js"></script>
        <script src="http://d3js.org/topojson.v1.min.js"></script>
        <style type="text/css">
            .province.BEL-2 { fill: #ccebc5; }
            .province.BEL-3 { fill: #bc80bd; }
            .province.BEL-3474 { fill: #d9d9d9; }
            .province.BEL-3475 { fill: #fccde5; }
            .province.BEL-3476 { fill: #b3de69; }
            .province.BEL-3477 { fill: #fdb462; }
            .province.BEL-3478 { fill: #80b1d3; }
            .province.BEL-3479 { fill: #fb8072; }
            .province.BEL-3480 { fill: #bebada; }
            .province.BEL-3481 { fill: #ffffb3; }
            .province.BEL-3482 { fill: #8dd3c7; }
        </style>
    </head>
    <body>
        <script type="text/javascript">
        var width = 1160;
        var height = 960;
        var scale = 25000;
        var offset = [width / 2, height / 2];
        var center = [0, 50.64];
        var rotate = [-4.668, 0];
        var parallels = [51.74, 49.34];

        var projection = d3.geo.albers()
            .center(center)
            .rotate(rotate)
            .parallels(parallels)
            .scale(scale)
            .translate(offset);

        var path = d3.geo.path()
            .projection(projection);

        var svg = d3.select("body").append("svg")
            .attr("width", width)
            .attr("height", height);

        d3.json("belprovtest.json", function(error, be) {
            if (error) return console.error(error);

            var bounds  = path.bounds(topojson.feature(be, be.objects.subunits));
            var hscale  = scale*width  / (bounds[1][0] - bounds[0][0]);
            var vscale  = scale*height / (bounds[1][1] - bounds[0][1]);
            scale   = (hscale < vscale) ? hscale : vscale;
            offset  = [width - (bounds[0][0] + bounds[1][0])/2,
                                height - (bounds[0][1] + bounds[1][1])/2];
            var centroid = d3.geo.centroid(topojson.feature(be, be.objects.subunits));
            center = [0, centroid[1]];
            rotate = [-centroid[0],0];

            projection = d3.geo.albers()
                .center(center)
                .rotate(rotate)
                .parallels(parallels)
                .scale(scale)
                .translate(offset);

            path = path.projection(projection);

            svg.selectAll(".province")
                .data(topojson.feature(be, be.objects.provinces).features)
                .enter()
                .append("path")
                .attr("class", function(d) { return "province " + d.id; })
                .attr("d", path);
        });
        </script>
    </body>
</html>
Now you will get the following image:
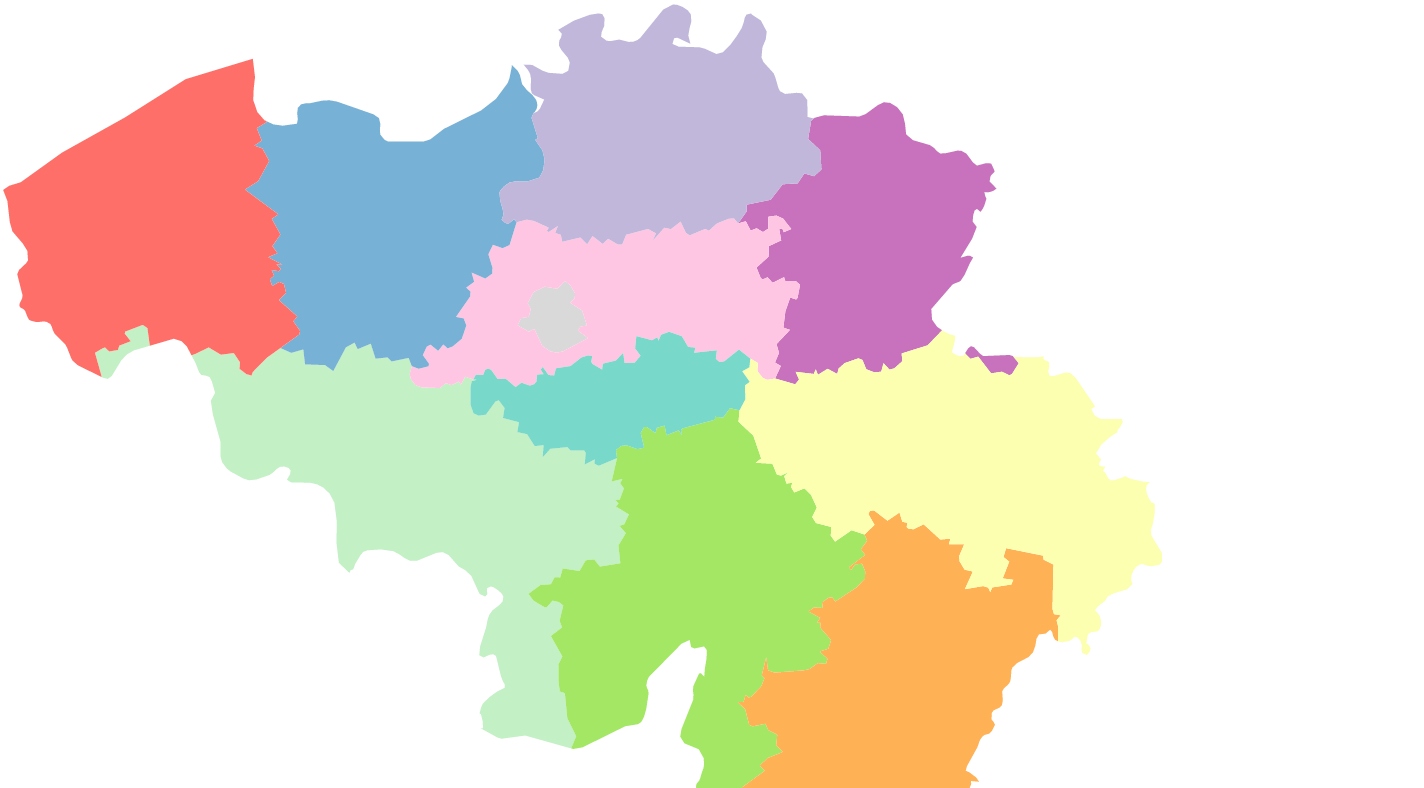
The colors aren’t that nice but you probably get the picture.