Hitchhiker's guide to the VDA lab
(inspired by the PLoS Computational Biology paper “You Are Not Working For Me; I Am Working With You”)
- What we do, and why…
- We don’t operate in a vacuum
- You are in charge
- Communication is important
- Presenting our work to the outside world
- The social side
What do we do exactly, and why?
Let’s start with the…
…why
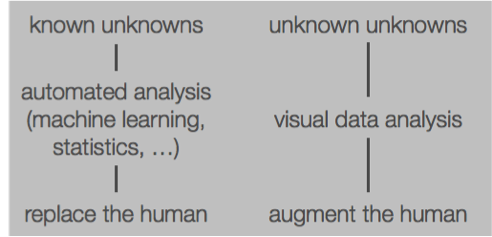
It is my firm belief that we need to put the human back in the loop of data analysis. As datasets become increasingly large and heterogeneous, they are often reused for investigating different hypotheses. Although automated data mining and statistical analyses are very useful, we more and more bump into the shortcomings of a purely automated analysis. What if we want to explore a dataset and see what’s in it, regardless of having a predefined question or not? By putting a human back into the loop, visual data analysis enables us to search for the “unknown unknowns”, and define novel hypotheses in data. Finding the right answer to a question is easy; finding the interesting questions given the data is much harder.
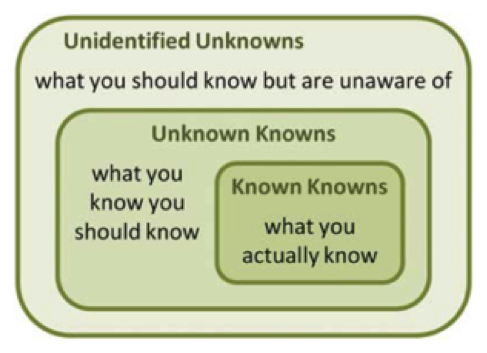
Another issue with automated analysis methods is that they often act as black boxes, in which case the user needs to have a blind trust in the algorithm developer that the results are actually correct. But it doesn’t stop there: the developer him/herself needs to trust his/her own skills as well, as it can be very difficult to understand what the impact is of different (combinations of) models and parameters on the outcome of the algorith.
In short: instead of replacing the human, we should augment the human.
…how
Now how do we approach this?
We try to augment that expert user with interactive data visualization. In particular, we’re targeting two aspects: visual design, and scalability.
Visual design
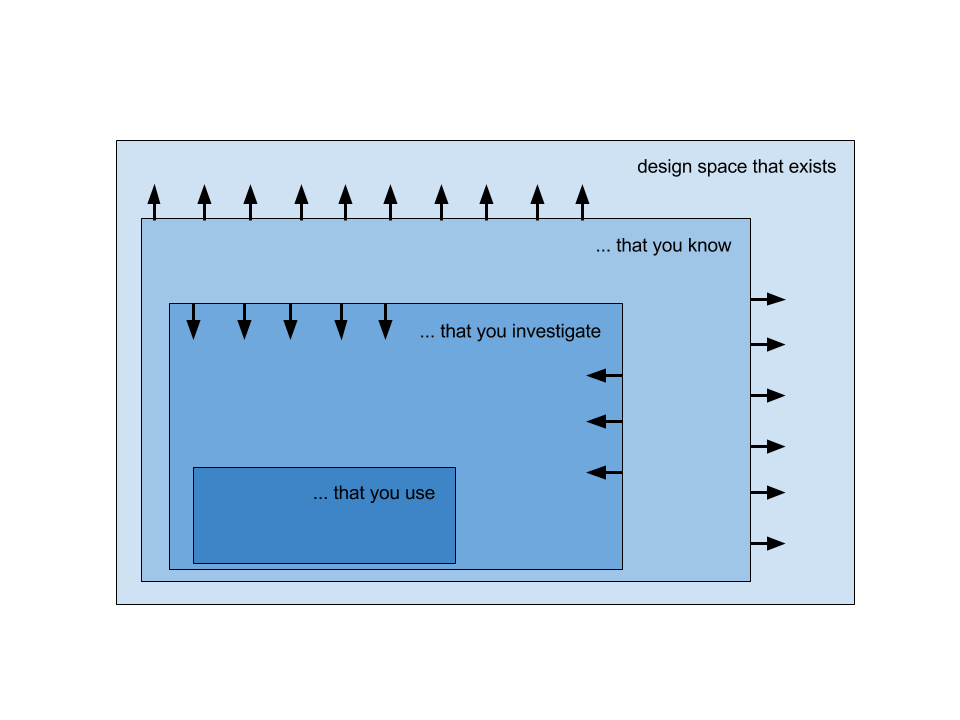
As data get much richer with often a huge number of dimensions, we need to find ways to condense more information into the visual, moving from literal representations to more abstract ones. Design space that exists is infinite. We need to try and expand the designer’s (your) visual library by extending the design space that you know, and prevent design fixation. At the same time, we need to investigate how to interact with the domain expert to get a good idea of the specific motivations in order to shrink the design space that you need to investigate. This task analysis in particular may be difficult because it starts off being unclear due to the inherent exploratory nature. In the end, we want to extend theoretical frameworks and methodologies for design strategies for visualization involving biological data.
Scalability
There are two different aspects when it comes to scalability: perceptual scalability and computational scalability.
Perceptual scalability - Schneiderman’s well-known mantra for interactive data visualization states: “Overview first, then zoom and filter, and details on demand”. That’s all well and good, until you start working with big data. Following this mantra naively, we could try to plot all 53,192,981 datapoints on a screen to get the overview of the data, but our computer would choke on this. In addition, to get fluid interaction, one often states that a scene refresh should take less than 0.3 seconds (although some other views on this start to emerge as well). When a raw dataset is big enough, there is no way to fluently pan, zoom or filter the data. So you need to present a condensed view of the data in the first stage. Of course if you for example create clusters, then the user might not know which clusters are interesting to digg into. That’s why we’re investigating the degree-of-interest feature: we’re devising ways to taint aggregated datapoints according to interestingness. The question is: how can we define this interestingness? We’re looking at interestingness defined by the data, but might look into that defined by previous user interactions as well.
Computational scalability - Of course to calculate data aggregations on the fly for visualization we need to have a scalable computing infrastructure. To that effect, we’re looking into data structures and backends such as hadoop and spark.
…what
To get a flavour of past projects, have a look at our portfolio page (even though it’s far from complete). But as it’s always good to look at some nice pictures: here are some :-)
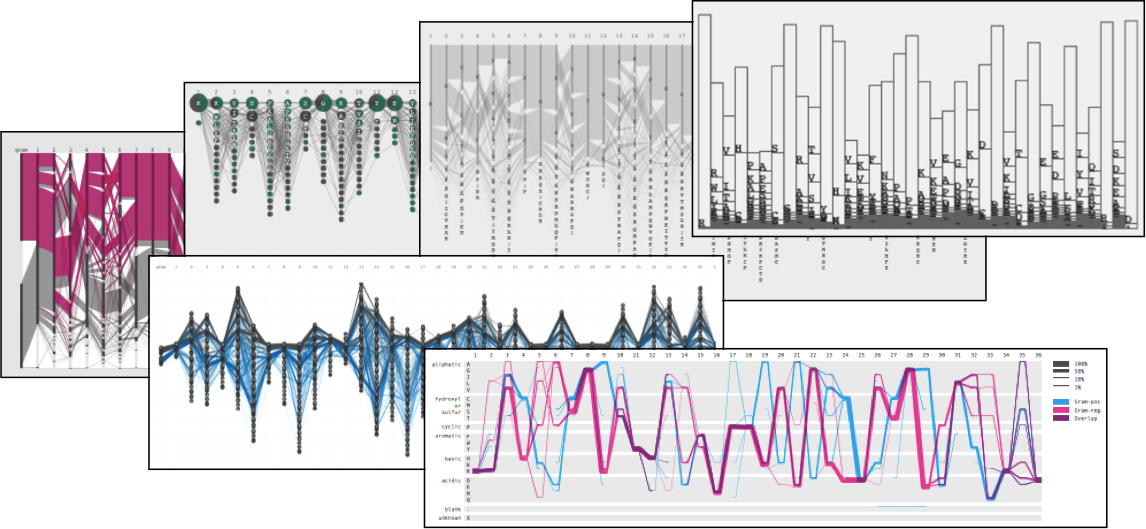
Data sketching working towards the Sequence Diversity Diagram
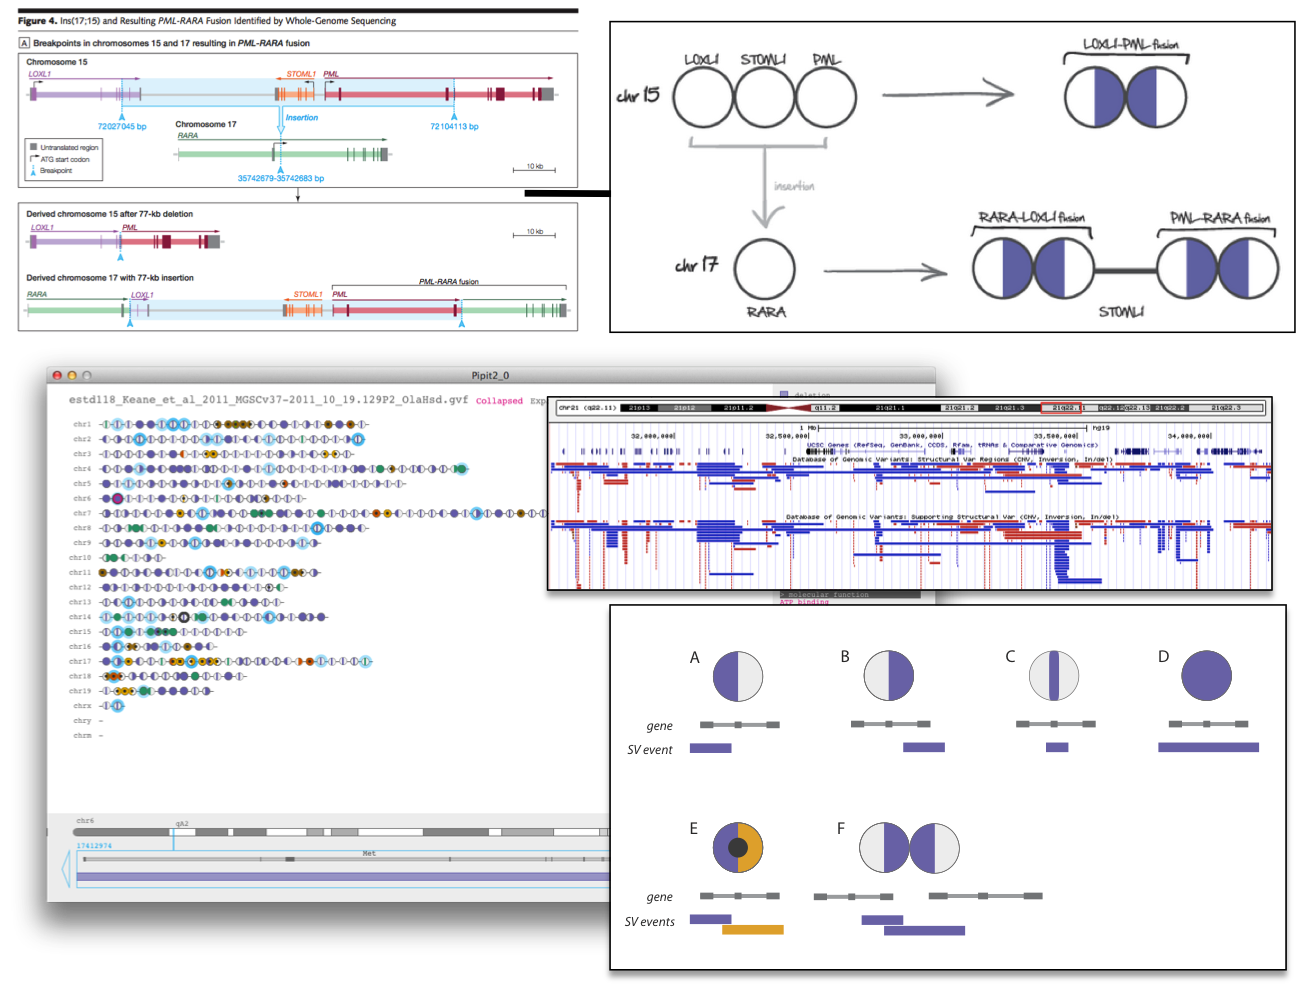
Pipit - visualizing structural genomic variation
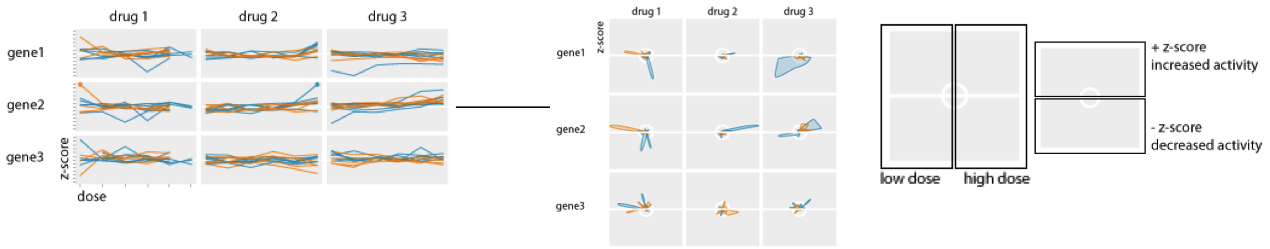
Fly plot - dosage-related drug response
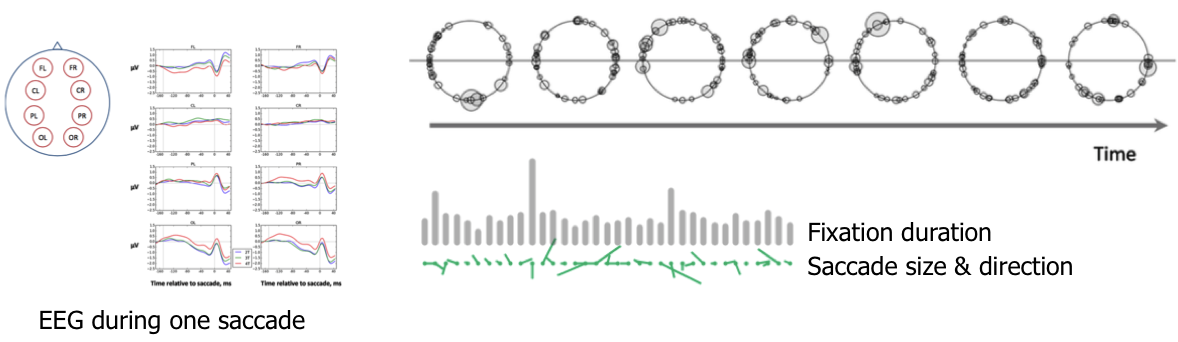
Eye movement saccades - student project by A Zharikova & R Meghanathan
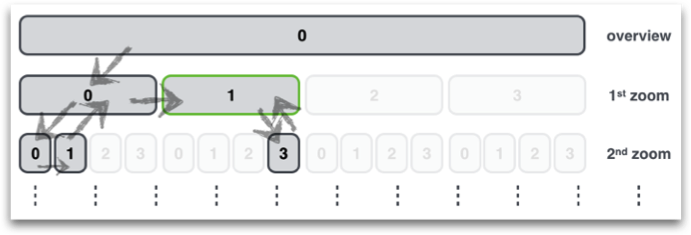
Locustree - data structure for multi-resolution view on big data
We don’t operate in a vacuum
The VDA-lab is embedded in the Bioinformatics (BIOI) research group of the STADIUS division at the Department of Electrical Engineering (ESAT) of the Faculty of Engineering at the KU Leuven. It’s a mouth-full…
We’re also part of the Medical IT department of iMinds. iMinds is a distributed research institute with researchers spread over all universities in Flanders. It focuses on more applied research.
Finally, the Visual Data Analysis lab is part of the Data Visualization Lab. The DVL brings together different visualization-related groups within the university. Apart from ourselves, the Dava Visualization Lab consists of Andrew Vande Moere’s group at the department of Architecture (ASRO) and the Human-Computer Interaction group at the CS department with Erik Duval and Katrien Verbert.
As both STADIUS and iMinds are the official affiliations, you will always have to mention both in your presentations, and on your posters and papers.
For your PhD, specifically, you will also get to know the Arenberg Doctoral School, or ADS for short, quite well. They define what needs to be done at different stages of your PhD. Your contact person at the faculty is Veronique Cortens. However, she is on pregnancy leave, and is temporarily covered by Edith Amery (FYI: my wife Indra Hautekiet works at ADS part-time as well). You can follow up your progress through your KULoket -> “Research” -> “PhD progress”. That’s also where you will need to upload the necessary documents at the necessary times.
You are in charge
I expect you to manage your own PhD, both at the conceptual and the practical level. Of course I will be there to guide you, but the final responsibility lies with you. At the conceptual level, this means that you (in collaboration with me) will define your research question in the first couple of months. This research question will then be the running thread throughout the work that you do. At the practical level, this involves making sure that the right forms are submitted at the right time to ADS, that you plan your 6-month strategy meeting with me, etc.
During your PhD there are some pre-defined moments where things can be corrected. Most important are the 9-month and 24-month presentations, as defined by ADS. At 9 months after the start of your PhD, we (you and I) need to assess if it makes sense to pursue the rest of the PhD or not. It might be that you’d fit better in a commercial than a research environment, for example, or your background and skills might not fit as good as we expected it to be. The presentation at 24 months is more to take stock and give clear direction to the second half of your PhD.
Tension between priorities
There is a high chance that your PhD is paid for by a project (or even several). In many cases, these projects are very applied, and include very clear deliverables at set dates (e.g. “15/9/2015: created algorithm that prioritizes individuals”). As these deliverables must be reached, your work is a balancing exercise between your long-term PhD research goals, and the shorter term project goals. The way to approach this, is to see the project deliverables as stepping stones towards your overall PhD. Don’t worry; I’ll help you with that.
In addition to these projects, I also expect every PhD student to (help) write a grant proposal in the second half of their time here. This is not to harrass you; it’s to help you. I did not have the chance to do this during my own PhD and postdocs, which meant that the very first time I had to write a grant proposal was when I started as a tenure-track professor here in Leuven. And I can tell you: that is way to late.
As a PhD student, you will also be called upon to act as teaching assistant for some of my (or other’s) courses. In contrast to some of my colleagues, your contribution will be limited. Typically, you will be in charge of setting up and/or running some exercise sessions, and supervise some exams. You are not expected, for example, to create exams and correct them.
Communication is important
More and more, I find email lacking in its ability to inform me of what’s happening around me. There are 5,351 unread emails in my inbox as I write this, so there are bound to be some things that I’m missing. Even more important, email is not transparent. You cannot follow discussions unless you’re copied into the emails themselves. This also applies when someone new (you) comes into the lab: they can only read up on past communication if all emails are forwarded. Therefore, we as a group started using SocialCast a couple of years ago. This tool basically acts like Twitter, but with only messages from within our group. When you start in the lab, make sure that I create an account for you. In principle, we don’t send any emails within the lab, but only use SocialCast. Whereas SocialCast is for discussions in general, we also use Slack for some specific projects. Typically, those also have members from outside of the lab, which is not the case for SocialCast.
Internal meetings
We also try to sit together regularly to discuss what happens in the group. I try to have a general labmeeting every week, or at least drop by the office to discuss the different projects. The article that I reference at the top of this guide mentions 2+1 meetings which also seem very interesting to do, but we have not done yet. In those meetings, two random students discuss their projects with me which might lead to interesting interactions. Every 6 months, we will have a strategy meeting to discuss where your PhD research is going, how it interacts with the different projects, and how we should set priorities.
Apart from the internal meetings, there are also additional ones that you will typically attend. First of all, there’s the bi-weekly YAC meeting (“Yves-and-colleagues”) where one student from the Bioinformatics group presents his work to be discussed. There’s also the BIG meeting (“Bioinformatics Interest Group”) at the Gasthuisberg hospital, where bioinformaticians from different groups and faculties come together. Finally, the weekly CME meeting (“Centrum voor Menselijke Erfelijkheid”) is relevant for those working with genetic data. That’s the place where geneticists present their current work and where we can find interesting opportunities for collaborating. Each of these meetings (YAC, BIG, CME) has a schedule of talks, and you will probably be asked to present once per year at each.
Update report
At the end of each month, I’d like to have a small 1-page overview of how you’re doing. This should cover the following:
- progress on your PhD
- what paper(s) are you working towards?
- progress on specific projects
- are you on schedule with your projects? If not: why, and what can we do about it?
- planning for the next month
Presenting our work to the outside world
Communication is one of the most important aspects of research: we need to discuss our ideas with colleagues outside of the lab, present what we’ve done so that they can build further on it, as well as learn from others.
Conferences
As a member of our group (be it a PhD student or postdoc), you are expected to present your work at different conferences. They are a great opportunity to discuss ideas and concepts with fellow researchers from other groups. In general, conferences want you to submit a “conference paper” some months before the event itself. This paper (which can be quite long, depending on the conference) will typically get peer-reviewed. If it’s accepted, you will probably end up giving a talk at that conference. So conference papers are very important. They are also the currency that you will use to get your PhD: you will need a number of good papers otherwise you will not be allowed to defend. There are several conferences that are relevant for what we do. First, there are the visualization-specific ones. These include IEEE VIS, VIZBI, BioVis, and EuroVis. IEEE VIS is the largest of these, and is normally held in the US. This is the conference where we often learn about new visual encodings, new frameworks, etc. Each year there are some smaller conferences that precede IEEE VIS, which are called SIGs (special-interest-groups). These include VAST, Beliv, DECISIVe, and BioVis. BioVis is of particular importance to us as our lab lives at the border of data visualization and biology. (Also: I have been on the organizing committee for several years, and am general co-chair in 2016 and 2017; Ryo is also on the OC since 2015.) EuroVis is very similar to IEEE VIS, but at a somewhat smaller scale and is obviously held in Europe. VIZBI, finally, is more aimed towards the biologist. It’s the venue where biologists come explain how they used data visualization in their work, and talk about the challenges they encounter. The conferences that have a “paper track” (i.e. that invite people to submit a paper) send out a CFP (“call for papers”) 6 months or more before the actual conference. This CFP describes what type of paper you can submit (topics, length, …), and what the deadlines are. Although the CFP normally should come out long before the submission deadline, that is too late to start thinking about what you could write. So you will have to think about submitting something long before the CFP is released. Basically, you should throughout the year always be working towards one or two specific submissions. There is something to say for just letting the research take you where it wants to (freewheeling-style), but having this focus can help tremendously to get things done in the end. Accepted papers are often (but not always) also made available as journal papers (see below). A general tip is to work from the result backwards: what would you want to present in a year’s time, and work towards that.
Some conferences also have challenges. The BioVis conference, for example, has had a data contest and visual design contest since the beginning. They provide the dataset and the question, and it is your role to think of a good solution. Some BioVis challenges in the past included the visualization of 2-locus eQTL data, of resting-state functional MRI data, and a redesign of the sequence logo. Other conferences do something similar, for example the VAST challenge. With Ryo and Daniel, we’ve been really successful in the past in these challenges.
Some more biology-oriented conferences that might be relevant are ISMB, ECCB and BBC. ISMB is the largest bioinformatics conference, and its location alternates between the US and Europe. The BioVis conference is sometimes organized alongside ISMB rather that IEEE VIS. ECCB (European Conference on Computational Biology) is co-organized with ISMB when the latter is in Europe; the other years it stands alone. BBC (Benelux Bioinformatics Conference), finally, is a more local event.
Apart from these more general conferences, there will be other more domain-specific ones that might be relevant to you, but not other members of the lab. These conferences might for example be about geo-spatial visualization or virology. Please make sure that you know which conferences you should keep an eye on.
What to take home from a conference?
Attending a conference can really help boost your research, or give it another direction. The trick is to get in with the right mindset.
It’s really important to talk to people at the conference. Ask questions after a talk, just walk to the person you want to talk to, … Interaction is key. That’s also the reason why giving a talk at a conference is good: people know who you are and can start discussions. The most interesting research happens when you talk to people and you end up collaborating. Think about what they can do for you, and what you can do for them.
When attending the talks, don’t make the error of taking them as they are if they are not about your specific topic. Look wide. Even though the topic or domain of the talk might be very different from your own, it might contain ideas or approaches that - when adapted - might be relevant for your own work as well. Also: take notes. Conferences like IEEE VIS and ISMB will bombard you with so much information that it’s impossible to recollect much of it afterwards. When back in Belgium, I expect you to give a talk for the rest of the group about things that were interesting, and how some of these things might influence your work.
Journal papers
Alongside conference papers, we also submit manuscript to different journals. In contrast to conference papers, they do not lead to giving a talk somewhere, which gets the discussion going and from which we can learn a lot. However, they have the huge advantage that there is no strict deadline: journals accept submission throughout the year. Relevant journals include Bioinformatics, BMC Bioinformatics, PLoS One and PeerJ.
Blog
Finally, I noticed that having a blog years ago did open quite a few doors for me. That’s why we write blog posts here as well. If there is something that took you a long time to figure out (and for which you have searched blogs for a solution), that might be a good opportunity to write your own contribution.
The social side
A lab stands or falls with the people who’re part of it. Unfortunately, the setup at ESAT does not really make social interactions very easy: there is no real social space, and my office is also quite far from the student’s office. That does not mean that we should only sit behind our desks. The really good ideas sprout from interactions, not from sitting behind a desk on your own.
That is one of the reasons why I find spontaneous interaction so important. To be fair, we can even direct that a little bit. Have lunch together, have breakfast once in a while, etc. We also had a BBQ at my home this year, which I hope to repeat every summer. It might be fun to semi-organize other things as well. Game nights, anyone? (Note to self: assign a “social champion”).
Voila, that’s it. This “hitchhiker’s guide” serves as much as a reminder for me on what to focus on with the lab, as I hope it can help you to make sense of why we do things the way we do them.
Enjoy your time at the lab,
jan.