Radviz rewrite in D3
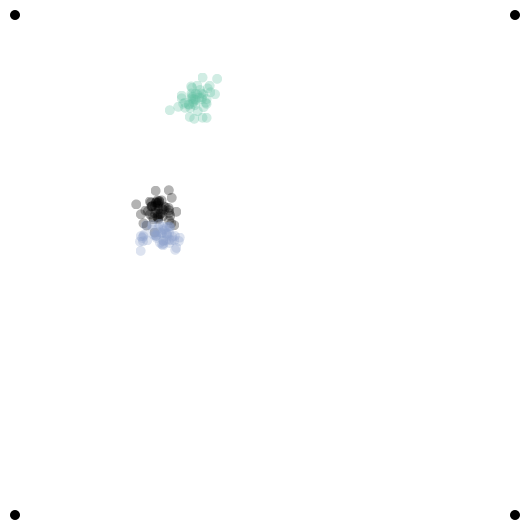
After having written radviz using paper.js, I wanted to tip my toes in D3 again. My playing with paper.js has helped getting an idea of the way of javascript, necessary to write good D3 as well. The code below is basically the same as the one for the paper.js version, except that the drawing code is now outside of the Attractor and DataPoint classes.
Of course, this could also be done using force-directed layout, but in this case we calculated the positions ourselves.
So here goes…
BTW: I clipped the actual dataset to get a few datapoints in the file itself so that you can see what the data looks like without swamping the code with just data…
var irisData = [
  {sepalLength:4.6,sepalWidth:3.2,petalLength:1.4,petalWidth:0.2,species:"I. setosa",colour:"#66c2a5"},
  {sepalLength:5.3,sepalWidth:3.7,petalLength:1.5,petalWidth:0.2,species:"I. setosa",colour:"#66c2a5"},
  {sepalLength:5.0,sepalWidth:3.3,petalLength:1.4,petalWidth:0.2,species:"I. setosa",colour:"#66c2a5"},
  {sepalLength:7.0,sepalWidth:3.2,petalLength:4.7,petalWidth:1.4,species:"I. versicolour",color:"#fc8d62"},
  {sepalLength:6.4,sepalWidth:3.2,petalLength:4.5,petalWidth:1.5,species:"I. versicolour",color:"#fc8d62"},
  {sepalLength:6.3,sepalWidth:2.9,petalLength:5.6,petalWidth:1.8,species:"I. virginica",colour:"#8da0cb"},
  {sepalLength:6.5,sepalWidth:3.0,petalLength:5.8,petalWidth:2.2,species:"I. virginica",colour:"#8da0cb"}
]

var svg = d3.select("body").append("svg").attr("width", 1000).attr("height", 1000)

function Attractor(name, x, y) {
	this.name = name
	this.x = x
	this.y = y
}

function DataPoint(attractions, species, colour) {
	this.attractions = attractions
	this.species = species
	this.colour = colour
    this.totalAttractorForce = function() {
     return this.attractions.map(function(a) {return a.force}).reduce(function(a,b) {return a+b})
    }
    this.coordinateX = function() {
        return this.attractions.map(function(a) {return a.force*a.attractor.x}).reduce(function(a,b) {return a+b})/this.totalAttractorForce()
    }
    this.coordinateY = function() {
        return this.attractions.map(function(a) {return a.force*a.attractor.y}).reduce(function(a,b) {return a+b})/this.totalAttractorForce()
    }
    this.coordinates = [this.coordinateX(),this.coordinateY()]
}

attractorSepalLength = new Attractor('sepal length',50,50)
attractorSepalWidth = new Attractor('sepal width',550,50)
attractorPetalLength = new Attractor('petal length',50,550)
attractorPetalWidth = new Attractor('petal width',550,550)
var attractors = [attractorSepalLength,attractorSepalWidth,attractorPetalLength,attractorPetalWidth]

var datapoints = []
for ( var i = 0; i < irisData.length; i++ ) {
    datapoints.push(new DataPoint([{attractor:attractorSepalLength,force:irisData[i].sepalLength},
                            			{attractor:attractorSepalWidth,force:irisData[i].sepalWidth},
                            			{attractor:attractorPetalLength,force:irisData[i].petalLength},
										{attractor:attractorPetalWidth,force:irisData[i].petalWidth}],
									irisData[i].species,
									irisData[i].colour))
}

svg.selectAll("circle")
	.data(attractors)
	.enter()
	.append("circle")
	.attr({
		cx: function(d) { return d.x },
		cy: function(d) { return d.y },
		r: 5
	})

// Draw datapoints
svg.selectAll("circle")
	.data(datapoints)
	.enter()
	.append("circle")
	.attr({
		cx: function(d) { return d.coordinateX()},
		cy: function(d) { return d.coordinateY() },
		r: 5,
		fill: function(d) { return d.colour },
		opacity: 0.3
	})
	.on('mouseover', function() { d3.select(this).attr('fill','red').attr('opacity',1).attr('r',8)})
	.on('mouseout', function(d) { d3.select(this).attr('fill',d.colour).attr('opacity',0.3).attr('r',5)})