Demo: Iris
This notebook explores how UMAP behaves when combined with the \(k\)-nearest minimum spanning tree (\(k\)-MST) and noisy minimum spanning tree union (\(n\)-MST) on the Iris dataset. The dataset consists of two clusters that only connect when considering the \(26\)-nearest neighbors. Our goal is to find a graph with a single connected component that describes how these clusters are oriented, while maintaining their local structure.
[1]:
%load_ext autoreload
%autoreload 2
[2]:
from umap import UMAP
from sklearn.datasets import load_iris

from multi_mst import KMST, KMSTDescent, NoisyMST
from lib.drawing import draw_umap
[3]:
X, y = load_iris(return_X_y=True)
UMAP layouts
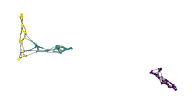
Cannot cross larger gaps without introducing many local edges.
[4]:
for k in [5, 40]:
    p = UMAP(n_neighbors=k, repulsion_strength=0.1, min_dist=0.2).fit(X)
    draw_umap(p, color=y, name="iris", alg=f"umap_{k}", size=1.2, alpha=1)


\(k\)-MST layouts
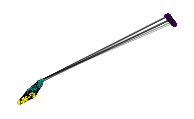
Crosses all gaps \(k\) times resulting in fairly uniform connectivity.
[8]:
for k in [4]:
    p = KMST(num_neighbors=k).fit(X).umap(repulsion_strength=0.1, min_dist=0.2)
    draw_umap(p, color=y, name="iris", alg=f"kmst_{k}", size=1.2, alpha=1)

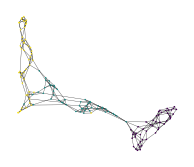
The approximate version based on nearest neighbor descent can be faster on (high-dimensional) datasets that do not behave nicely with KDTrees.
[9]:
for k in [4]:
    p = KMSTDescent(num_neighbors=k).fit(X).umap(repulsion_strength=0.1, min_dist=0.2)
    draw_umap(p, color=y, name="iris", alg=f"kmst_descent_{k}", size=1.2, alpha=1)

\(n\)-MST Layouts
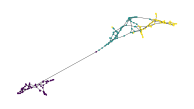
Tend not to cross large gaps multiple times unless the noise fraction is high enough.
[14]:
for k in [10]:
    p = NoisyMST(num_trees=k, noise_fraction=0.6).fit(X).umap(repulsion_strength=0.1, min_dist=0.2)
    draw_umap(p, color=y, name="iris", alg=f"nmst_{k}", size=1.2, alpha=1)
