Here is a very simple barchart defined in altair R.
The dataset used for this chart is:
Var1 = c("a","b","c","d","e")
Var2 = c(11, 19, 22, 8, 14)
Var3 = c("type1","type1","type2","type1","type2")
dataset = data.frame(Var1, Var2, Var3)
and below is the code to generate it:
chart_1 = alt$Chart(dataset)$
  mark_bar()$
  encode(
    x = "Var1:O",
    y = "Var2:Q"
  )$
  properties(
    height=200,
    width=400
  )
What is the syntax in altair R? It is similar to the altair Python with the major difference the usage of the operator $ to access attributes, instead of .. We should note that there are some other differences of the Python and the R package described at the Field Guide to Python Issues together with examples. Below, are the most common properties of the chart syntax:
- We first need to use the object
altto access the Altair API and create a chart usingalt$Chart. - The
datato be visualised is called inside thealt$Chart. - The
markused is specifed aftermark_. Values as properties of the marks, for instance a hard-coded size or color, can be specified here. - The
encodedetermines the mapping between the channels and the data fields. The encoding that is dependent on the fields is specified here, not the encoding that has to do with values of the marks. Here,xandyare the position channels. The field type is specified after the field name.Ostands for ordinal andQfor quantitative. Other types areNfor nominal,Tfor temporal andGfor goejson. Thex = "Var1:O"is the short form ofx = alt$X("Var1", type = "ordinal"). The two forms are equivalent but the long form is used when doing more adjustments unside encoding. We will see an example in the field transform section. - The height and width of the plot is specified inside
properties.
For more detailed references in Altair classes and functions, we may look to the API reference.
Now, to display the chart in Rstudio we may use vegawidget(chart_1) or chart_1. Alternatively, we can also save the chart using:
htmlwidgets::saveWidget(vegawidget(chart_1),'chart_1.html')
and display it in the browser by opening the chart_1.html file.
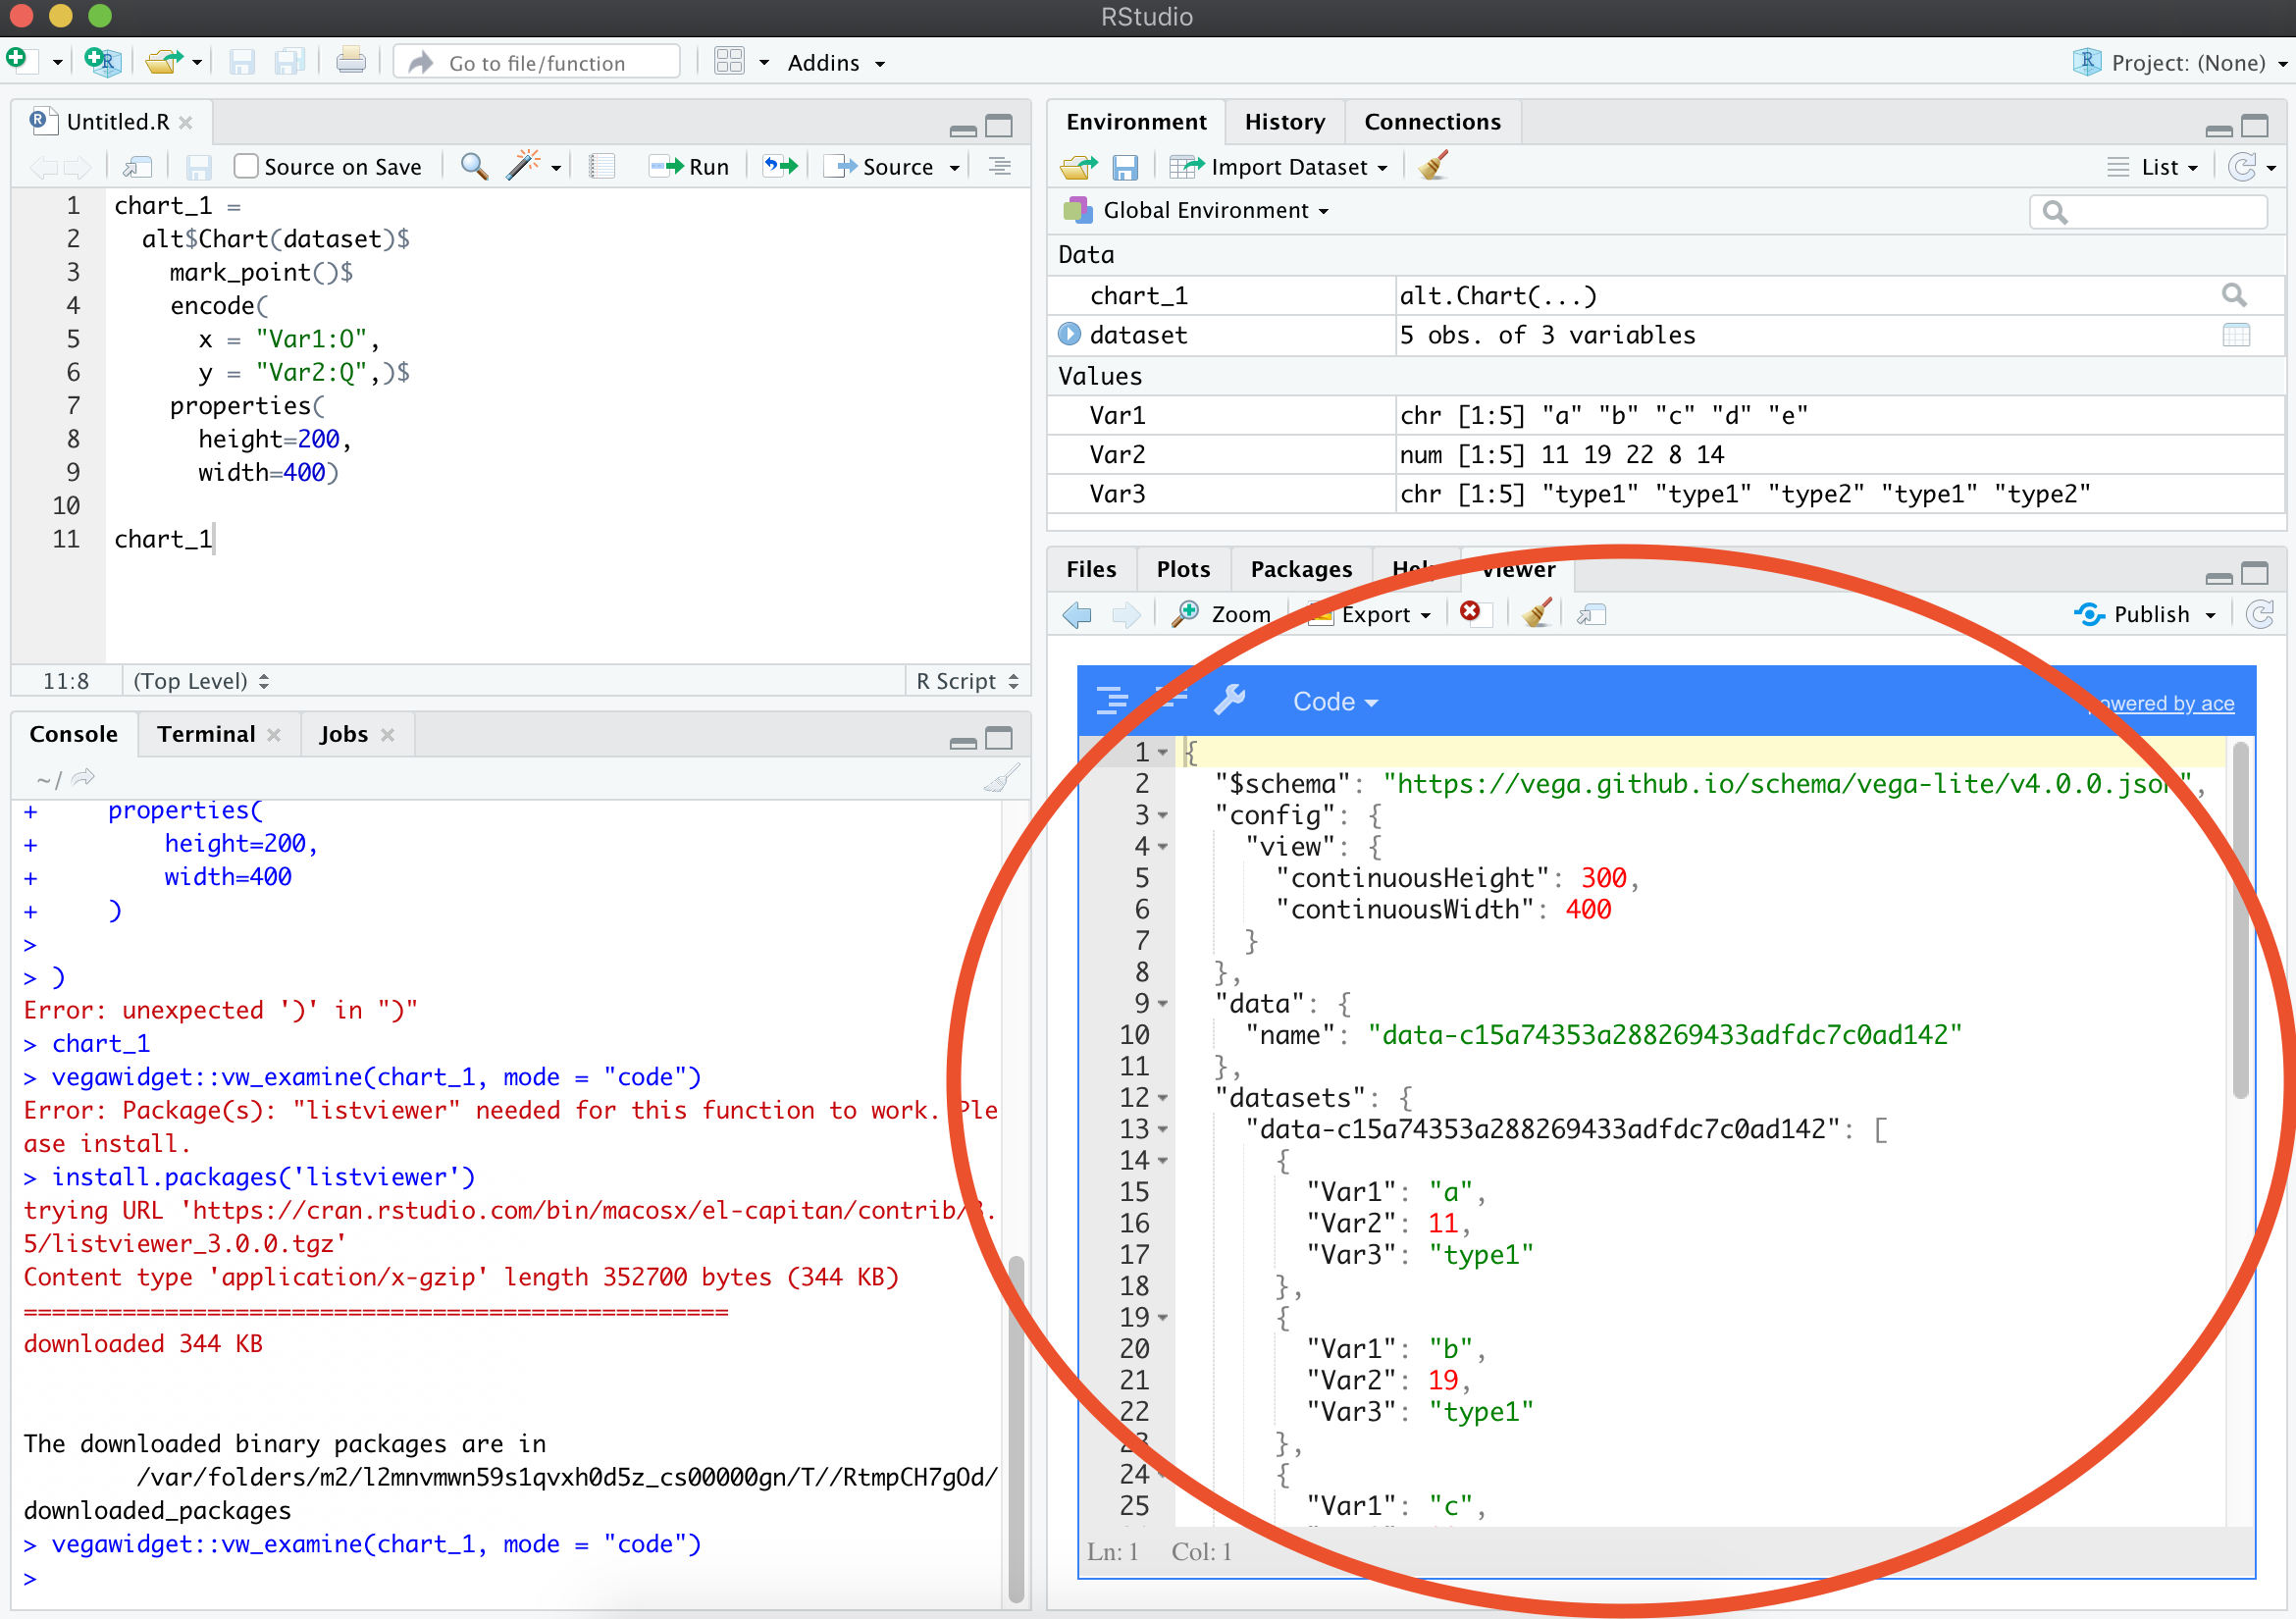
To examine the chart specification in R we can install the package listviewer using install.packages("listviewer") and use:
vegawidget::vw_examine(chart_1, mode = "code")
The output is below:
Exercise - Make yourself comfortable with the basic syntax of the chart in the altair R. Use the color channel for Var3 to make the chart below. Change the height and width of the panel.
Exercise - Visualise the same data, using a point as the mark, change the color for all points to black and visualise Var3 using size. Format the axes.