With what we’ve learned so far we can create dashboards that contain different graphics, bits of text, etc. But we weren’t able yet to link these things together. That’s what we’ll do here.
A single widget
As a very first example, we’ll create our simple barchart again, but include a colour picker so that we can change the colour of the bars. Notice that the vega part is exactly what we had before, except for the fact that we also define the color.
colour_picker = pn.widgets.ColorPicker(value="#4682b4")
colour_picker.width = 50

@pn.depends(colour_picker.param.value)
def plot(value):
    return pn.pane.Vega({
        "$schema": "https://vega.github.io/schema/vega-lite/v4.json",
        "description": "A simple bar chart with embedded data.",
        "data": {
          "values": [
            {"a": "A", "b": 28},
            {"a": "B", "b": 55},
            {"a": "C", "b": 43},
            {"a": "D", "b": 91}
          ]
        },
        "mark": "bar",
        "encoding": {
          "x": {"field": "b", "type": "quantitative"},
          "y": {"field": "a", "type": "nominal"},
          "color": {"value": value}
        }
      })
pn.Row(colour_picker, plot)
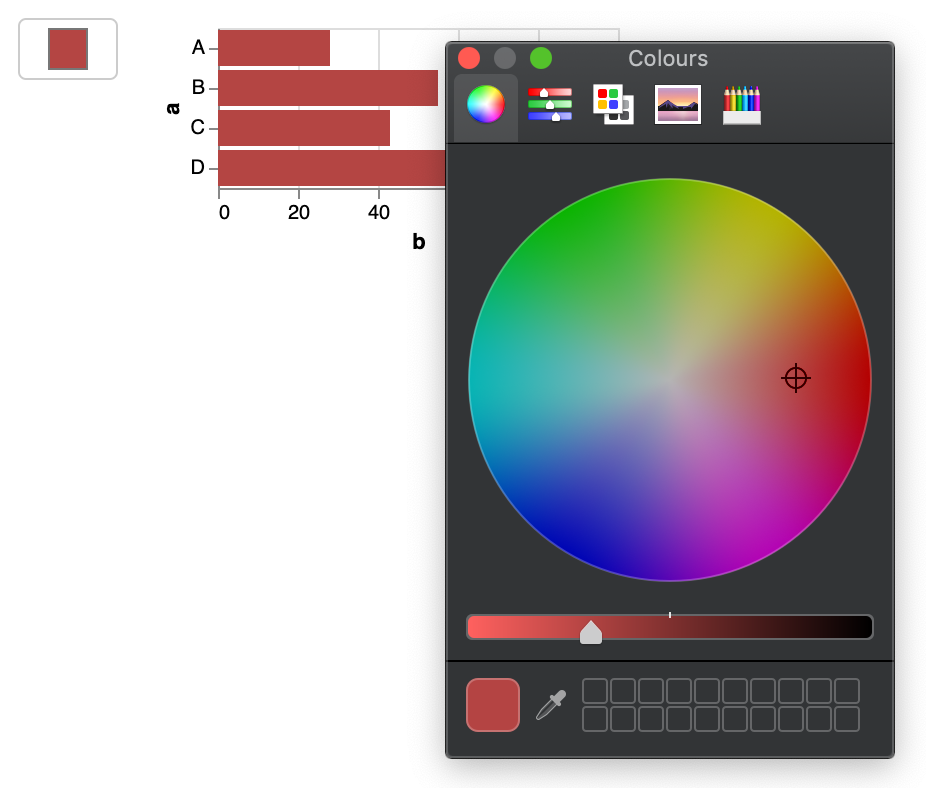
We create a pn.Row() with the colour_picker and the plot. How did we make this work?
- The
colour_pickeris aColorPickerwidget. Again, for the complete list of all 30 available widgets, check thepaneldocumentation at https://panel.holoviz.org/user_guide/Widgets.html. - Instead of just creating the
specas a JSON object, we now create a function (calledplot) that returns such JSON. - We need to decorate the
plotfunction so that the function is re-run every time a new colour is chosen. We do this with@pn.depends(colour_picker.param.value). When thatcolour_picker.param.valuechanges, it will be passed as the first argument to theplotfunction. - We replaced the actual colour in the specification with
valuewhich is the name of the first (and only) argument to the function.
From the sci-py lecture notes on decorators:
Since functions and classes are objects, they can be passed around. Since they are mutable objects, they can be modified. The act of altering a function or class object after it has been constructed but before it is bound to its name is called decorating.

There are two things hiding behind the name "decorator" — one is the function which does the work of decorating, i.e. performs the real work, and the other one is the expression adhering to the decorator syntax, i.e. an at-symbol and the name of the decorating function.

Function can be decorated by using the decorator syntax for functions:

@decorator             # ②
def function():        # ①
    pass

A function is defined in the standard way. ①
An expression starting with @ placed before the function definition is the decorator ②. The part after @ must be a simple expression, usually this is just the name of a function or class. This part is evaluated first, and after the function defined below is ready, the decorator is called with the newly defined function object as the single argument. The value returned by the decorator is attached to the original name of the function.
Note: if you get the error Vega pane does not support objects of type 'dict'., make sure you added the schema to your JSON spec: "$schema": "https://vega.github.io/schema/vega-lite/v4.json".
Multiple widgets
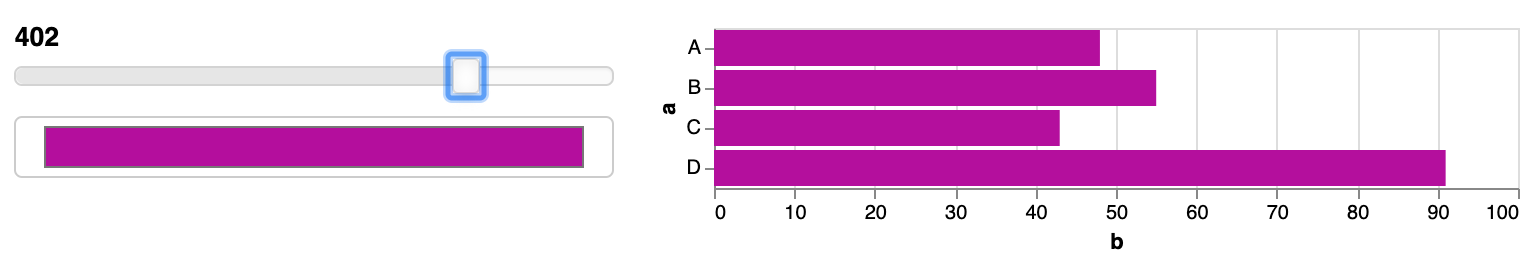
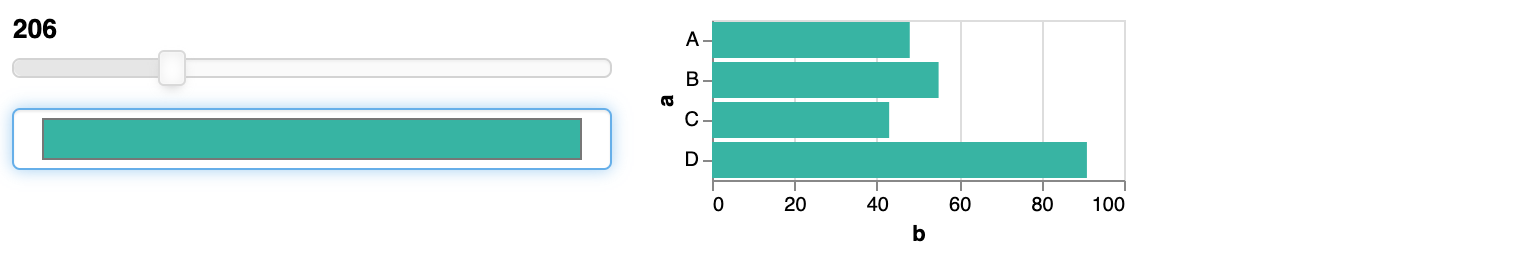
The above is just with one parameter, but we can use more than one. Let’s say we want to also be able to change the width of the plot. We can create a new IntSlider widget, whose value we will use for the width section in the specification.
colour_picker = pn.widgets.ColorPicker(value="#4682b4")
slider_value = pn.widgets.IntSlider(start = 100, end = 500)

@pn.depends(slider_value.param.value, colour_picker.param.value)
def plot(slider, colour):
    return pn.pane.Vega({
        "$schema": "https://vega.github.io/schema/vega-lite/v4.json",
        "description": "A simple bar chart with embedded data.",
        "width": slider,
        "data": {
          "values": [
            {"a": "A", "b": 48},
            {"a": "B", "b": 55},
            {"a": "C", "b": 43},
            {"a": "D", "b": 91}
          ]
        },
        "mark": "bar",
        "encoding": {
          "x": {"field": "b", "type": "quantitative"},
          "y": {"field": "a", "type": "nominal"},
          "color": {"value": colour}
        }
      })
pn.Row(pn.Column(slider_value,colour_picker), plot)
Actual useful interaction
In the VegaLite tutorial at http:///visualisation-tutorial/vegalite-using-widgets-for-selection.html, we saw how we can define widgets within the specification to select subsets of the data. Let’s try and do the same with HoloViz widgets.
What we had before:
{
  "title": "Making selections",
  "data": {
    "url": "https://raw.githubusercontent.com/vega/vega/master/docs/data/cars.json"
  },
  "selection": {
    "my_selection": {
      "type": "single",
      "fields": ["Origin"],
      "bind": {"input": "select", "options": [null, "Europe", "Japan", "USA"]}
    }
  },
  "mark": "circle",
  "encoding": {
    "x": {"field": "Acceleration", "type": "quantitative"},
    "y": {"field": "Miles_per_Gallon", "type": "quantitative"},
    "color": {
      "condition": {
        "selection": "my_selection",
        "value": "red"
      },
      "value": "lightgrey"
    }
  }
}
Our output looked like this:
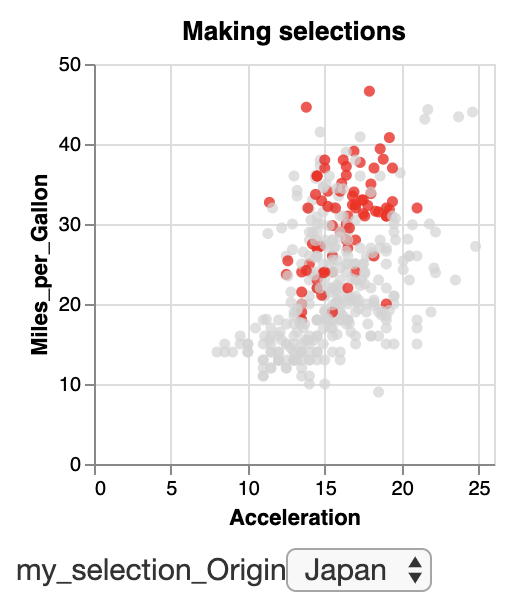
We can remove the selection section in the specification and replace "selection": "my_selection" with a test to obtain the following:
origin_picker = pn.widgets.Select(name="Origin", options=['USA','Europe','Japan'])
@pn.depends(origin_picker.param.value)
def plot2(origin):
return pn.pane.Vega({
"$schema": "https://vega.github.io/schema/vega-lite/v4.json",
"title": "Making selections",
"data": {
"url": "https://raw.githubusercontent.com/vega/vega/master/docs/data/cars.json"
},
"mark": "circle",
"encoding": {
"x": {"field": "Acceleration", "type": "quantitative"},
"y": {"field": "Miles_per_Gallon", "type": "quantitative"},
"color": {
"condition": {
"test": "datum['Origin'] == '" + origin + "'",
"value": "red"
},
"value": "lightgrey"
}
}
})
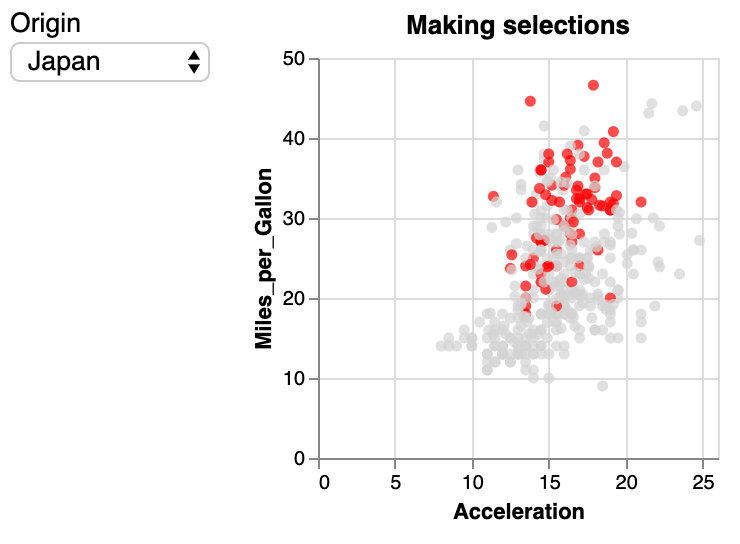
pn.Row(origin_picker, plot2)
Exercise - Change the last panel so that you can choose what should be put on the y-axis. Possible field names are: “Miles_per_Gallon”, “Displacement”, “Horsepower” or “Weight_in_lbs”. Make sure to use the correct case for these fields! The output should look similar to this: 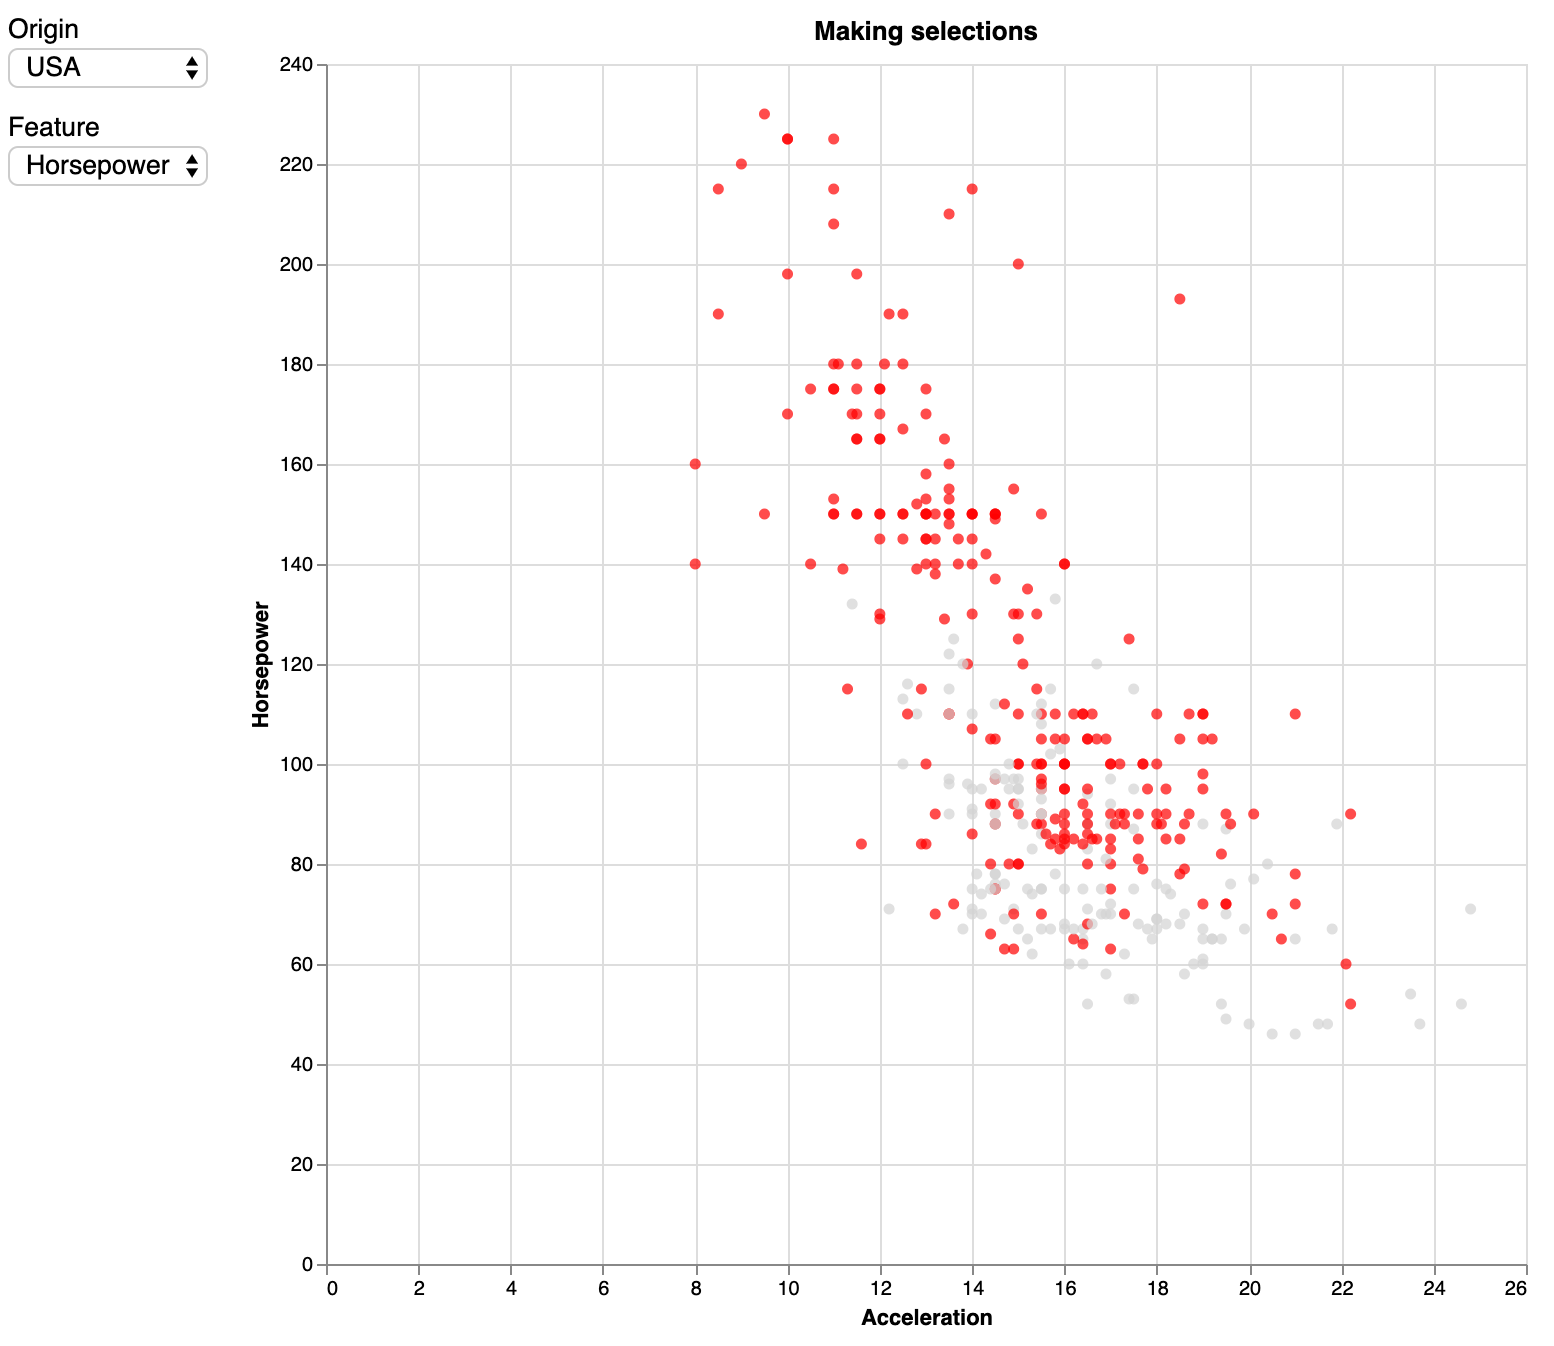
Exercise - Now also add a threshold slider for horsepower (minimum value is 40 and maximum value is 240). Any car with more horsepower than that threshold should be made bigger. The output should look similar to this: 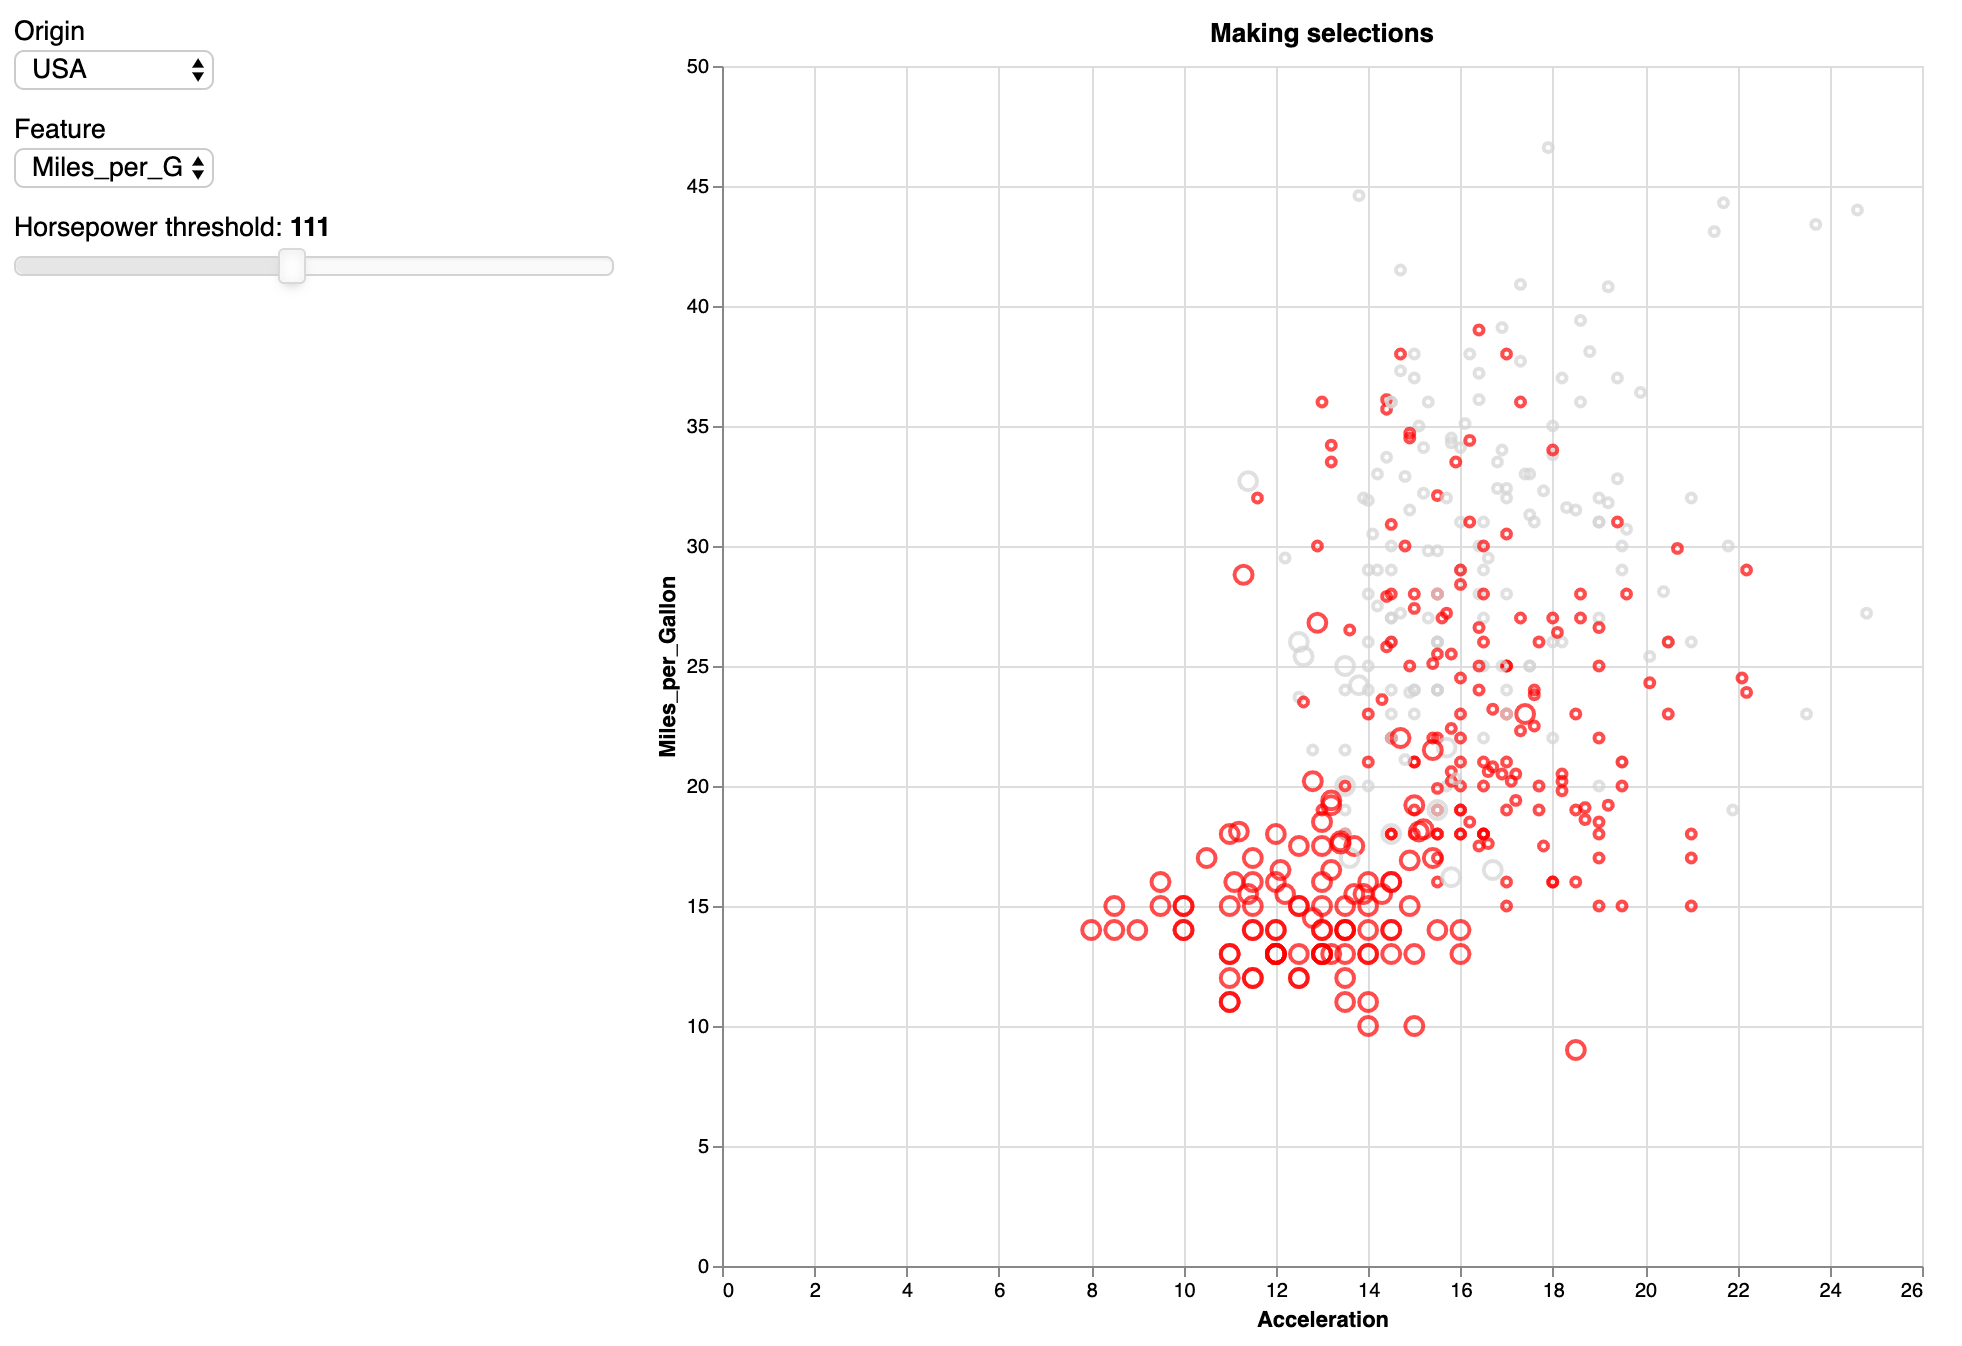
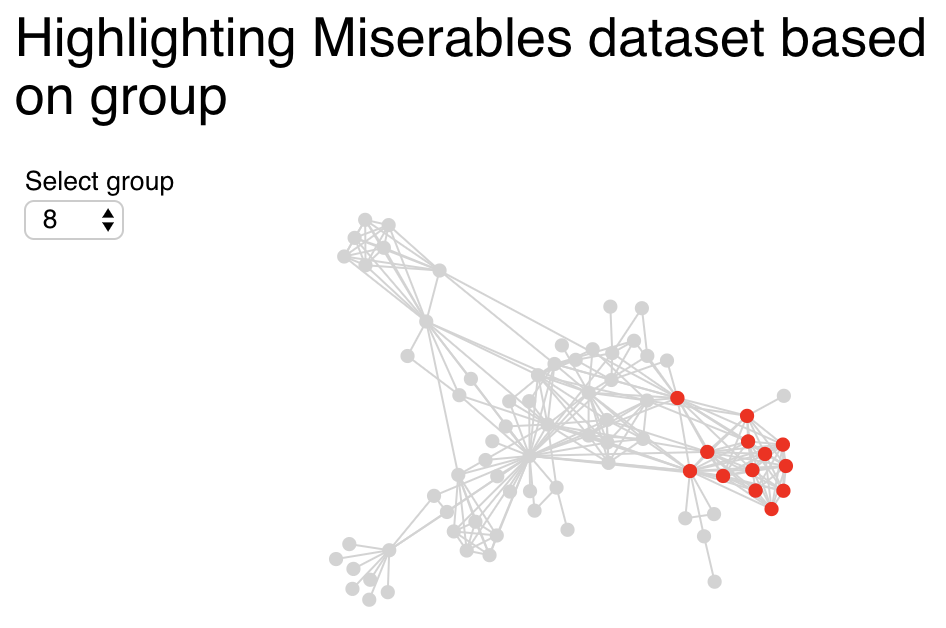
Here’s another example using the Miserables dataset:
group_picker = pn.widgets.Select(name="Select group", options=[0,1,2,3,4,5,6,7,8], width=50)

@pn.depends(group_picker.param.value)
def plot(gr):
    return pn.pane.Vega({
      "$schema": "https://vega.github.io/schema/vega/v5.json",
      "width": 400,
      "height": 275,
      "padding": 0,
      "autosize": "none",

      "signals": [
        { "name": "cx", "update": "width / 2" },
        { "name": "cy", "update": "height / 2" },
        {
          "description": "State variable for active node dragged status.",
          "name": "dragged", "value": 0,
          "on": [
            {
              "events": "symbol:mouseout[!event.buttons], window:mouseup",
              "update": "0"
            },
            {
              "events": "symbol:mouseover",
              "update": "dragged || 1"
            },
            {
              "events": "[symbol:mousedown, window:mouseup] > window:mousemove!",
              "update": "2", "force": True
            }
          ]
        },
        {
          "description": "Graph node most recently interacted with.",
          "name": "dragged_node", "value": None,
          "on": [
            {
              "events": "symbol:mouseover",
              "update": "dragged === 1 ? item() : dragged_node"
            }
          ]
        },
        {
          "description": "Flag to restart Force simulation upon data changes.",
          "name": "restart", "value": False,
          "on": [
            {"events": {"signal": "dragged"}, "update": "dragged > 1"}
          ]
        }
      ],

      "data": [
        {
          "name": "node-data",
          "url": "https://raw.githubusercontent.com/vega/vega-datasets/master/data/miserables.json",
          "format": {"type": "json", "property": "nodes"}
        },
        {
          "name": "link-data",
          "url": "https://raw.githubusercontent.com/vega/vega-datasets/master/data/miserables.json",
          "format": {"type": "json", "property": "links"}
        }
      ],

      "marks": [
        {
          "name": "nodes",
          "type": "symbol",
          "zindex": 1,

          "from": {"data": "node-data"},
          "on": [
            {
              "trigger": "dragged",
              "modify": "dragged_node",
              "values": "dragged === 1 ? {fx:dragged_node.x, fy:dragged_node.y} : {fx:x(), fy:y()}"
            },
            {
              "trigger": "!dragged",
              "modify": "dragged_node", "values": "{fx: null, fy: null}"
            }
          ],

          "encode": {
            "enter": {
              "fill": [
                { "test": "datum.group == " + str(gr),
                  "value": "red"},
                {"value": "lightgrey"}
              ]
            },
            "update": {
              "size": {"value": 50},
              "cursor": {"value": "pointer"}
            }
          },

          "transform": [
            {
              "type": "force",
              "iterations": 300,
              "velocityDecay": 0.4,
              "restart": {"signal": "restart"},
              "static": False,
              "forces": [
                {"force": "center", "x": {"signal": "cx"}, "y": {"signal": "cy"}},
                {"force": "collide", "radius": 5},
                {"force": "nbody", "strength": -10},
                {"force": "link", "links": "link-data", "distance": 15}
              ]
            }
          ]
        },
        {
          "type": "path",
          "from": {"data": "link-data"},
          "interactive": False,
          "encode": {
            "update": {
              "stroke": {"value": "lightgrey"}
            }
          },
          "transform": [
            {
              "type": "linkpath", "shape": "line",
              "sourceX": "datum.source.x", "sourceY": "datum.source.y",
              "targetX": "datum.target.x", "targetY": "datum.target.y"
            }
          ]
        }
      ]
    })
pn.Column(pn.pane.Markdown("## Highlighting Miserables dataset based on group"),
          pn.Row(group_picker, plot))
The output: