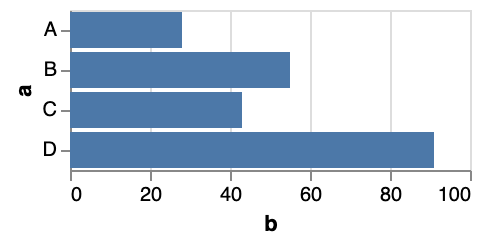
So let’s finally combine Panel with Vega. As for creating a pane with markdown text or a figure, we can use pn.pane.Vega() and give it a specification.
import panel as pn
from vega import Vega
pn.extension('vega')

spec = {
    "$schema": "https://vega.github.io/schema/vega-lite/v4.json",
    "description": "A simple bar chart with embedded data.",
    "width": 200,
    "height": 200,
    "data": {
      "values": [
        {"a": "A", "b": 28},
        {"a": "B", "b": 55},
        {"a": "C", "b": 43},
        {"a": "D", "b": 91}
      ]
    },
    "mark": "bar",
    "encoding": {
      "x": {"field": "b", "type": "quantitative"},
      "y": {"field": "a", "type": "nominal"}
    }
  }
pn.pane.Vega(spec)
You’ll get
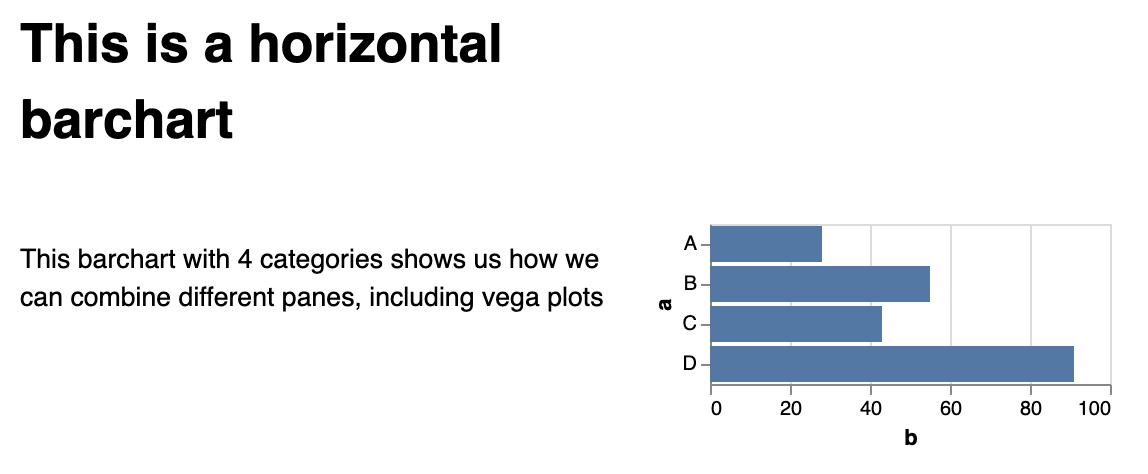
Now we can combine this with other panes. In the Vega and VegaLite tutorials, we defined the title within the specification itself. Now, instead, we can define it outside:
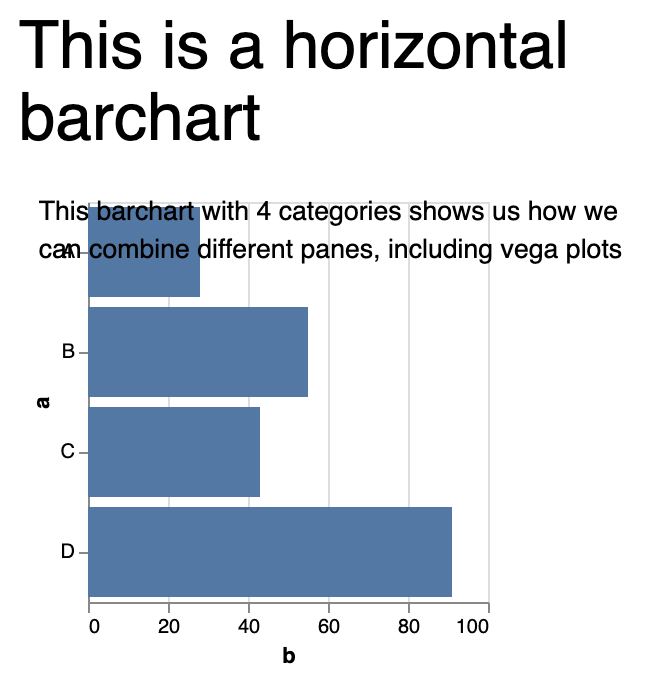
pn.Column(pn.pane.Markdown("# This is a horizontal barchart"),
          pn.Row(
                 pn.panel("This barchart with 4 categories shows us how we can combine different panes, including vega plots"),
                 pn.pane.Vega(spec)

          ))
Or combining two plots:
pn.Column(pn.pane.Markdown("# This is a horizontal barchart"),
          pn.Row(
                 pn.pane.Vega(spec),
                 pn.pane.Vega(spec)

          ))
By the way, do not forget to specify width and height of the plot, because panel cannot deduce that automatically. If you forget to do so, you’ll get overlapping panels like this: