The Panel library adds functionality to jupyter notebook for quickly and easily building interactive dashboards. There are 2 main concepts:
panel= a container of thingspane= one of these things. This could also be a widget.
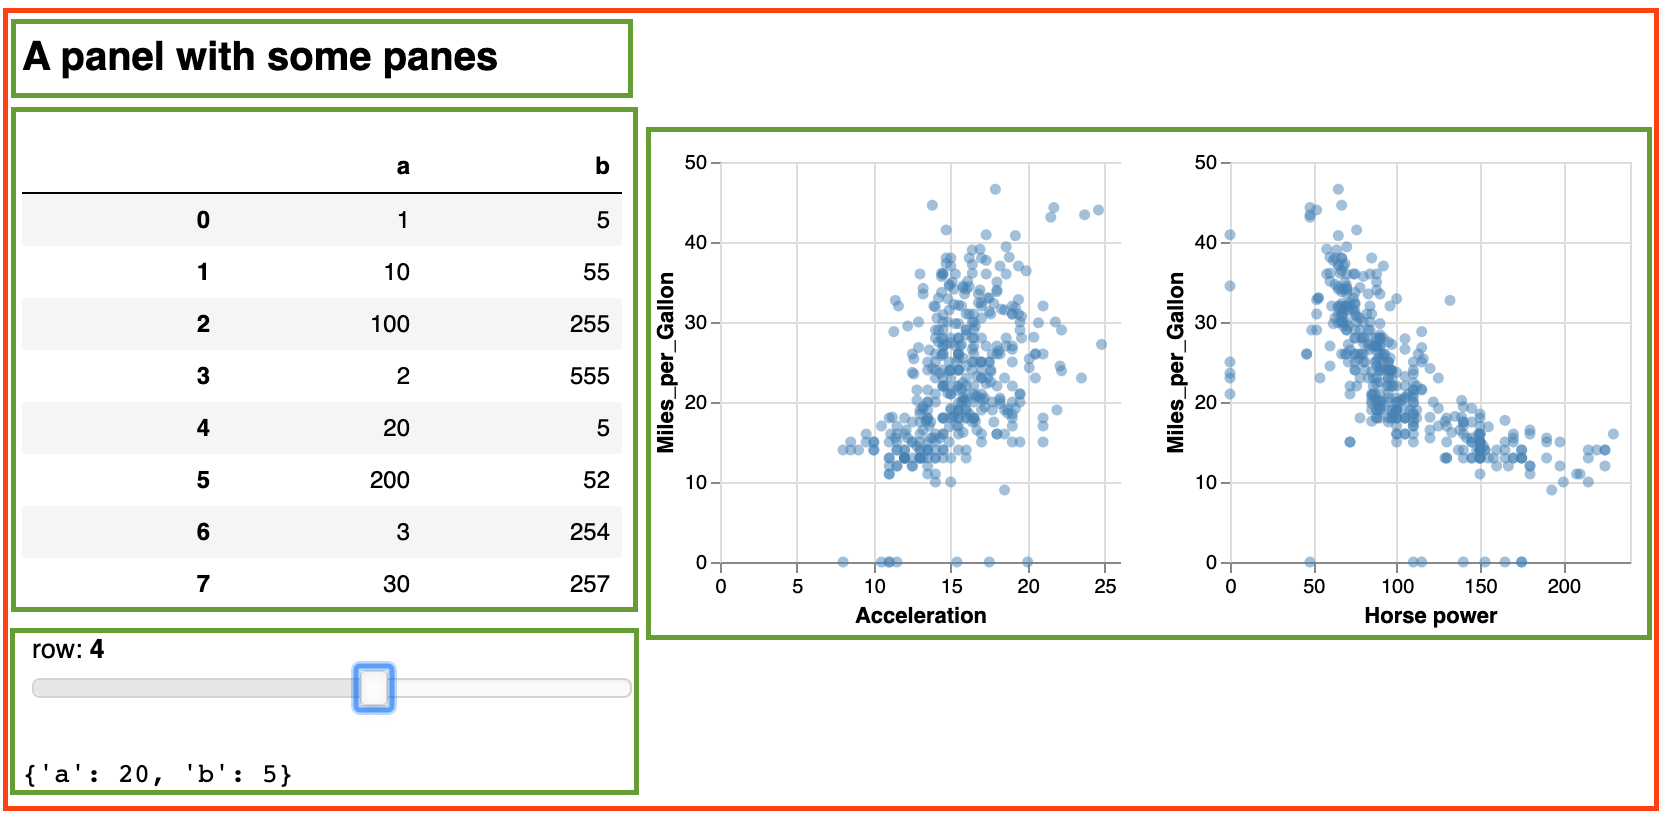
In the image below, the red rectangle is the “panel” and the green ones are “panes”.
Setting things up
You’ll have installed panel as instructed in one of the previous sections. To lead it into jupyter notebook, run
import panel as pn
pn.extension()
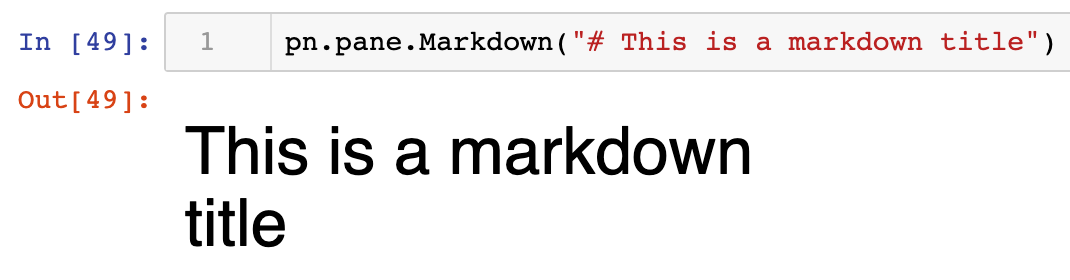
Proof-of-principle: we can now create a simple panel like this:
pn.pane.Markdown("# This is a markdown title")
What you’ll see is:
What are the different types of panes?
Just using markdown does not seem that interesting, but we can put other stuff in a pane as well, like images, vega code(!), etc. To find out what you can use, type pn.pane. and then a tab. This will show you all possibilities: bokeh, dataframe, gif, html, image, latex, plotly, svg, video, vtk, etc.
Panel and Google Colaboratory
Google Colaboratory is a great way to use jupyter notebooks. Access them through http://colab.research.google.com or straight from your google drive. Unfortunately, there are some quirks to take into account when working with Panel.
- You have to install panel and other modules every time again in your notebook with
!pip install panel,!pip install vega, etc. - Whereas you only have to write
pn.extension()once in a jupyter notebook, you have to do this in every cell in Colaboratory in which you use Panel. - You can’t use the
.show()method in Colaboratory (see /visualisation-tutorial/holoviz-sharing-dashboards.html).