To combine different plots in vega, we needed to create a layout with a marks section which itself contained other marks (see here).
...
"layout": {"padding": 20},
  "marks": [
    {
      "type": "group",
      "encode": {
        "update": {
          "width": {"value": 200},
          "height": {"value": 200}
        }
      },
      "marks": [
        {
          "type": "symbol",
          ...
        }
      ],
      "axes": [
        ...
      ]
    },
    {
      "type": "group",
      "style": "cell",
      "encode": {
        "update": {
          "width":  {"value": 200},
          "height": {"value": 200}
        }
      },
      "marks": [
        {
          "type": "symbol",
          ...
        }
      ],
      "axes": [
        ...
      ]
    }
  ]
}
...
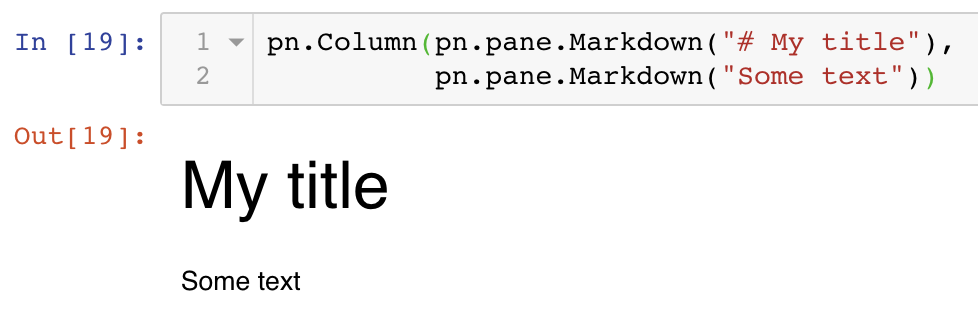
It’s not easy to keep an overview of what’s going on here, but panel makes things much more clear. We can layout different panes into a panel with rows, columns or tabs with pn.Column(), pn.Row() and pn.Tabs(), respectively. For example:
pn.Column(pn.pane.Markdown("# My title"),
          pn.pane.Markdown("Some text"))
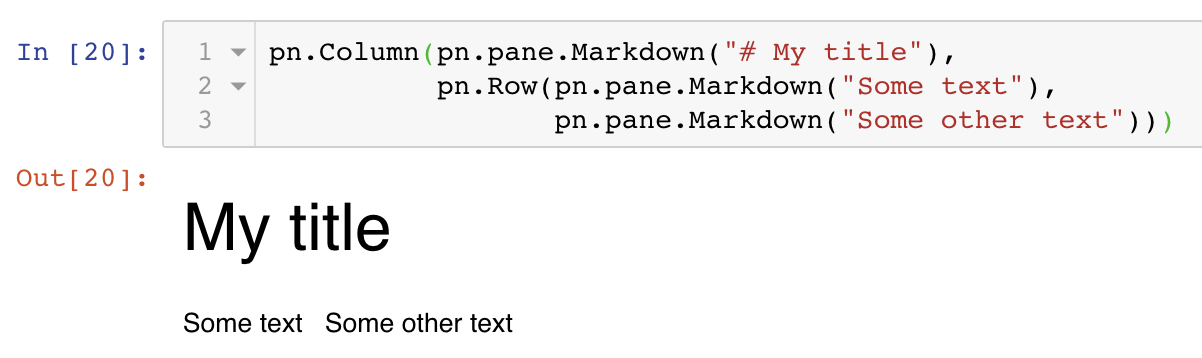
We can make the layout more complex by combining different tags:
pn.Column(pn.pane.Markdown("# My title"),
          pn.Row(pn.pane.Markdown("Some text"),
                 pn.pane.Markdown("Some other text")))
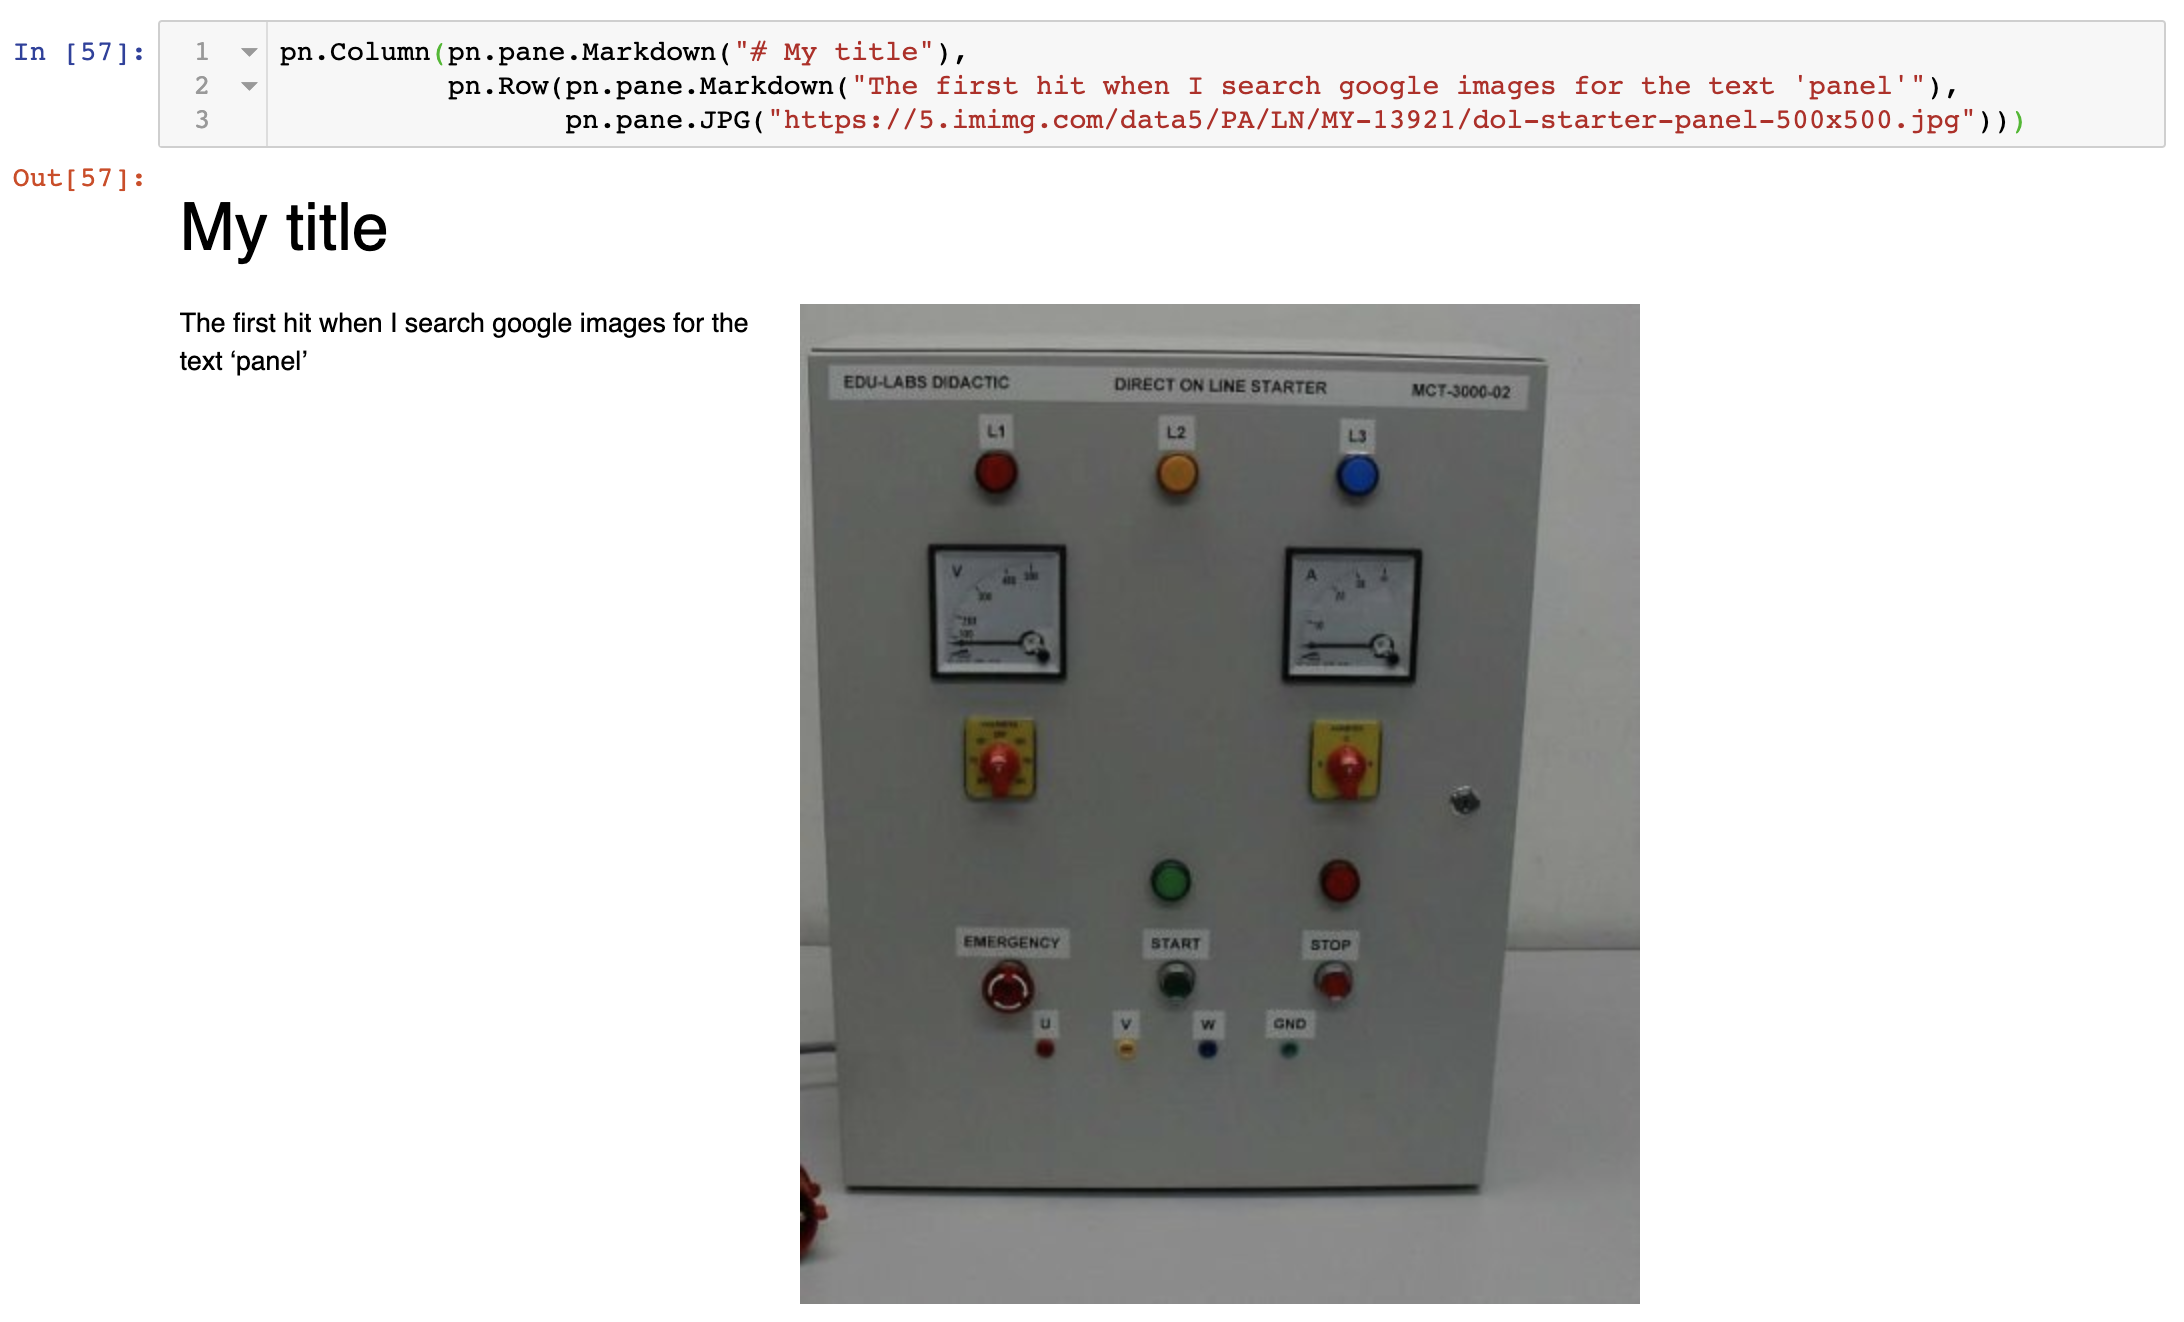
…and combining different types of panes:
pn.Column(pn.pane.Markdown("# My title"),
          pn.Row(pn.pane.Markdown("The first hit when I search google images for the text 'panel'"),
                 pn.pane.JPG("https://5.imimg.com/data5/PA/LN/MY-13921/dol-starter-panel-500x500.jpg")))
Exercise - Try out different layouts, including tabs.