In the previous step, we created a variable spec that contained the complete specification for the plot. One of the reasons we’re looking into using jupyter notebooks instead of the online vega editor, is that we can make a very long specification more manageable by splitting it up: we can extract different parts of the spec into separate variables.
A simple example
Let’s extract the dataset itself into a separate variable:
d = { "values":
          [ {"a": "A", "b": 28},
            {"a": "B", "b": 55},
            {"a": "C", "b": 43},
            {"a": "D", "b": 91} ]
        }
… and replace the dataset in the specification with that variable:
spec = {
    "$schema": "https://vega.github.io/schema/vega-lite/v4.json",
    "description": "A simple bar chart with embedded data.",
    "data": d,
    "mark": "bar",
    "encoding": {
      "x": {"field": "b", "type": "quantitative"},
      "y": {"field": "a", "type": "nominal"}
    }
  }
This will have the same result as we had earlier and means that we can build up our dataset within the jupyter notebook and then pass it on to the specification.
A more extensive example
Here’s a longer example (from /visualisation-tutorial/vegalite-brushing-and-linking.html) that makes it even more clear that it might be good to create the different sections of the specification separately.
The data:
cars_dataset = {
    "name": "cars",
    "url": "https://raw.githubusercontent.com/vega/vega/master/docs/data/cars.json",
    "format": {"type": "json"}
  }
The scales:
scales = [
  {
    "name": "acceleration_xscale",
    "type": "linear",
    "domain": {"data": "cars", "field": "Acceleration"},
    "range": [0, 200],
    "nice": true,
    "zero": true
  },
  {
    "name": "mpg_yscale",
    "type": "linear",
    "domain": {"data": "cars", "field": "Miles_per_Gallon"},
    "range": [200, 0],
    "nice": true,
    "zero": true
  },
  {
    "name": "horsepower_xscale",
    "type": "linear",
    "domain": {"data": "cars", "field": "Horsepower"},
    "range": [0, 200],
    "nice": true,
    "zero": true
  }
]
This will give you an error, because the true used in the Vega specification is lowercase, while a True in python needs to be capitalised. So we have to change this first.
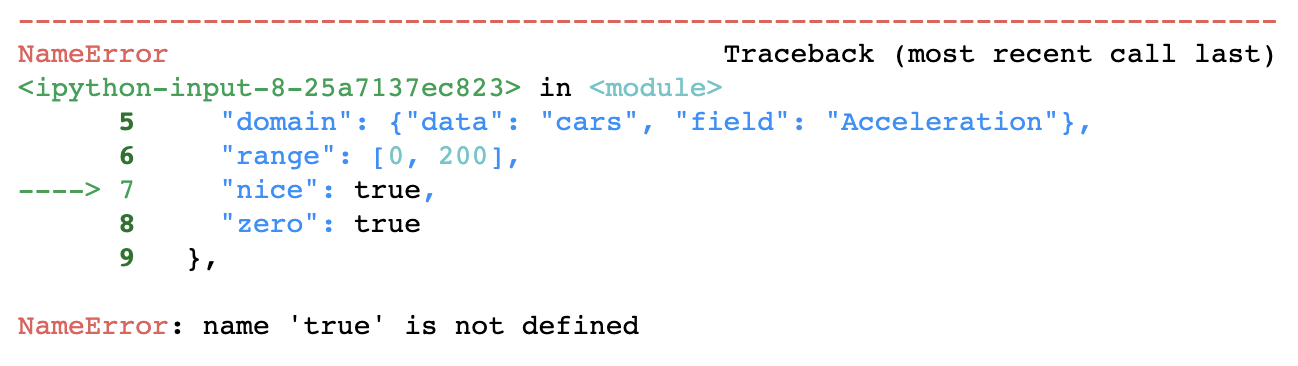
In all the code below, I’ve already made this change.
The axes:
mpg_y_axis = {
  "scale": "mpg_yscale",
  "orient": "left",
  "gridScale": "mpg_yscale",
  "grid": True,
  "tickCount": 5,
  "title": "Miles_per_Gallon"
}

acceleration_x_axis = {
  "scale": "acceleration_xscale",
  "orient": "bottom",
  "gridScale": "acceleration_xscale",
  "grid": True,
  "tickCount": 5,
  "title": "Acceleration"
}

horsepower_x_axis = {
  "scale": "horsepower_xscale",
  "orient": "bottom",
  "gridScale": "horsepower_xscale",
  "grid": True,
  "tickCount": 5,
  "title": "Horse power"
}
The plots themselves:
plot1 = {
  "type": "group",
  "encode": {
    "update": {
      "width": {"value": 200},
      "height": {"value": 200}
    }
  },
  "marks": [
    {
      "type": "symbol",
      "style": "circle",
      "from": {"data": "cars"},
      "encode": {
        "update": {
          "x": {"scale": "acceleration_xscale", "field": "Acceleration"},
          "y": {"scale": "mpg_yscale", "field": "Miles_per_Gallon"},
          "fill": {"value": "steelblue"},
          "fillOpacity": {"value": 0.5}
        }
      }
    }
  ],
  "axes": [ mpg_y_axis, acceleration_x_axis ]
}

plot2 = {
  "type": "group",
  "style": "cell",
  "encode": {
    "update": {
      "width":  {"value": 200},
      "height": {"value": 200}
    }
  },
  "marks": [
    {
      "type": "symbol",
      "style": "circle",
      "from": {"data": "cars"},
      "encode": {
        "enter": {
          "x": {"scale": "horsepower_xscale", "field": "Horsepower"},
          "y": {"scale": "mpg_yscale", "field": "Miles_per_Gallon"},
          "fill": {"value": "steelblue"},
          "fillOpacity": {"value": 0.5}
        }
      }
    }
  ],
  "axes": [ mpg_y_axis, horsepower_x_axis ]
}
This makes the final specification much more manageable:
spec2 = {
  "$schema": "https://vega.github.io/schema/vega/v5.json",
  "padding": 5,
  "data": [ cars_dataset ],
  "scales": scales,
  "layout": {"padding": 20},
  "marks": [
    plot1,
    plot2
  ]
}
The result is the following plot (that we also created in the vega tutorial).
We’ve seen in the debugging section of the Vega tutorial that the online vega editor has some very useful features for writing correct vega code. We don’t have those here, but being able to split up the code in smaller parts can help a lot, and we can build these parts up within the notebook.