Debugging in vega is not straightforward. As vega is a declarative language, we cannot add console.log() or print statements throughout the code to find out what is going on. Below are some methods that can help you figure out what the system is doing.
Indications in the editor itself
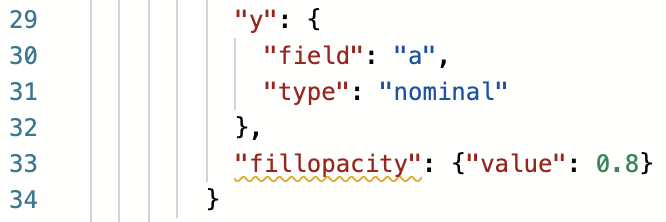
A big advantage of using the online editor instead of either a local editor such as Atom, Visual Studio Code or a tool such as jupyter notebook, is that the vega editor gives you an indication if something might be wrong. For example, in the image below, we used the key fillopacity which is not recognised by vega, as it should be fillOpacity. You can see that the unknown key is indicated with a yellow squiggly line.
Also, in certain cases it gives you the options between which you can choose. For example, the type of the field x in the next example should be nominal, ordinal, quantitative, or temporal.
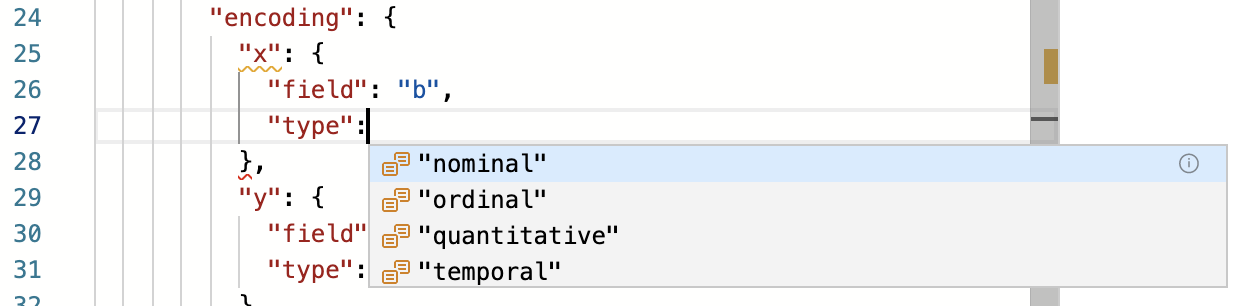
You’ll notice, by the way, that x and closing bracket } are underlined to indicate that that part of the specification is not valid JSON (yet).
Log, data viewer and signal viewer
When you use the vega online editor, you’ll see “logs”, “data viewer” and “signal viewer” in the bottom left:
- logs: will list the errors and warnings when the JSON is not valid vega. There should be something there is you see a squiggly line in the editor itself.
- data viewer: shows all the datasets in your specification. This is very helpful if you run transformations on the data (for example add additional fields to your data, or aggregate that data).
- signal viewer: very useful when debugging signals and triggers
Use vega-lite as starting point
If you can’t figure out how to do something in Vega but you do know how to do it in Vega-Lite, write the Vega-Lite specification first. Internally this will be converted into Vega. Underneath the vega editor, you’ll see a tab called “Compiled Vega”. Clicking on that gives you the Vega version of your Vega-Lite spec. You can then edit it using the “Edit Vega Spec” button.
You will notice that the generated Vega spec is very verbose and can rely on different magic incantations. Therefore, heed these tips:
- Make your Vega-Lite specification as bare-bones as possible: only include the functionality that is absolutely necessary to understand what is going on.
- In the generated Vega specification, start removing sections that look like they are not necessary. You’ll notice that you can remove quite a bit, for example things like
"expr": "isValid(datum[\"b\"]) && isFinite(+datum[\"b\"])" - Also, replace automatically generated signal/data/mark names (like
"concat_0_layer_1_bin_maxbins_10_IMDB_Rating_bins") to something that makes more sense to you.
Web browser console
How to find out that we have to use activated_datapoint.datum in the brushing and linking section? I must admit that this took me a while… In the signal viewer in the bottom right of the vega editor you can see that the value for activated_datapoint changes from null to (...) if we mouse over a datapoint. We cannot see what the value actually is. The vega documentation on debugging at https://vega.github.io/vega/docs/api/debugging/ tells us that we can access more information if we open the debug console of the web browser itself.
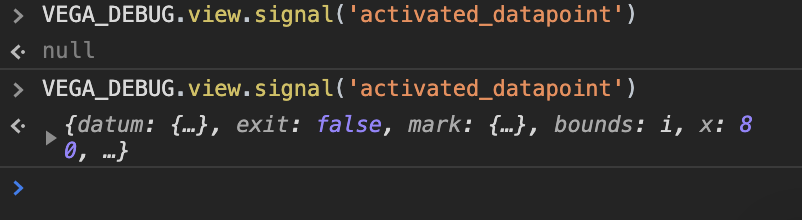
To open the debug console in Google Chrome, go to View => Developer => Developer Tools, and then click on Console. Type in VEGA_DEBUG.view.signal('activated_datapoint') in the console. The output will probably be null.
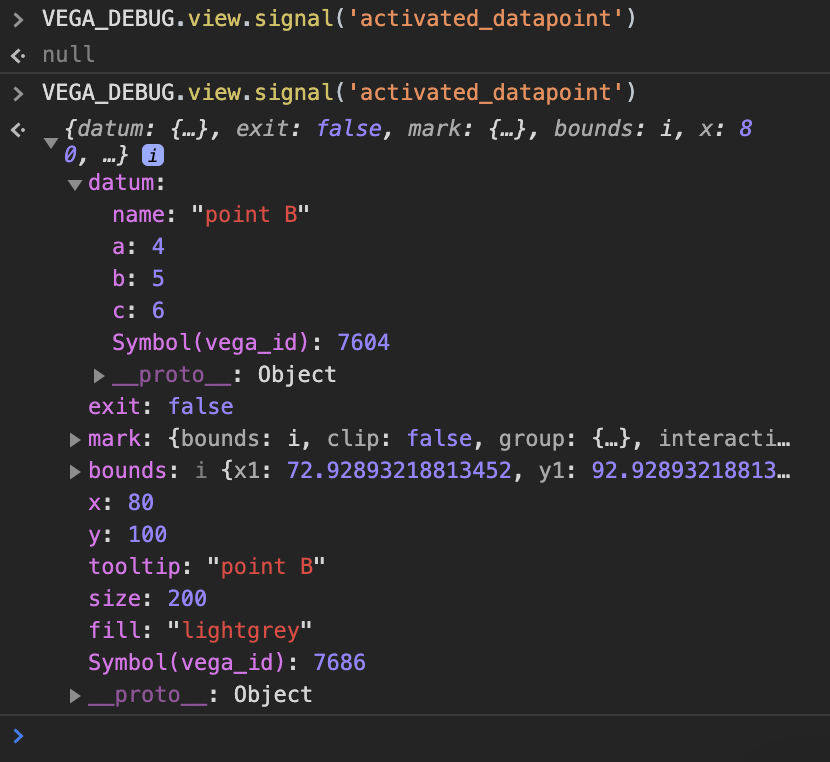
Now type in that command again, but without pressing enter. Put your mouse on top of a datapoint (without moving focus away from the console!) and press enter. You should now see something else than null. If you click on the small triangle next to the json object you’ll expand the object and see that the datum key corresponds to the datapoint that we put in. That’s why we use datum === activated_datapoint.datum as the test.
Exercise - Can you add an additional test for the fill? You can make a dummy one, e.g. testing if 1 == 1.
Exercise - Try out what happens if you don’t include the datapoint_is_activated in the test above. Tip: open the console as describe above in “Note on debugging”.