So once an event occurs, the corresponding signal changes. In the example above, every time the mouse is moved, the event.x (i.e. the horizontal position on the screen of where the event (i.e. the moving mouse) occurred) is made available to Vega through the mouseX variable/signal.
This mouseX can then be used like any field in the original data in the specification for the marks, scales, etc. You can conceptually consider signals similar to fields but being defined by interaction rather than the data.
Signals can be triggered either by interaction within the plot itself, or from elements outside of the plot such as a slider or selection box. We already have seen an example of the first case when we were moving the mouse around and showed the horizontal position of the mouse.
Triggers within the plot:
{
  "name": "mouseX",
  "on": [ {"events":"mousemove", "update": "event.x"} ]
}
Triggers using widgets:
{
  "name": "colourSelector",
  "bind": {"input": "select", "options": ["steelblue","red"]
}
(We’ll look further into widgets in the next section.)
Apart from signals that you define as shown above, there are also some that are pre-defined:
width,height,padding,autosizeparent: If you have defined groups, than usingparentin a specification of a mark within that group will refer to the group.datum,item,eventcursor
Debugging signals
Just recently a very useful tool was added to the vega editor: you can now record how signals change over time, and go back in time as well. You’ll find a “Record signal changes” button in the “Signal viewer” section at the bottom right.
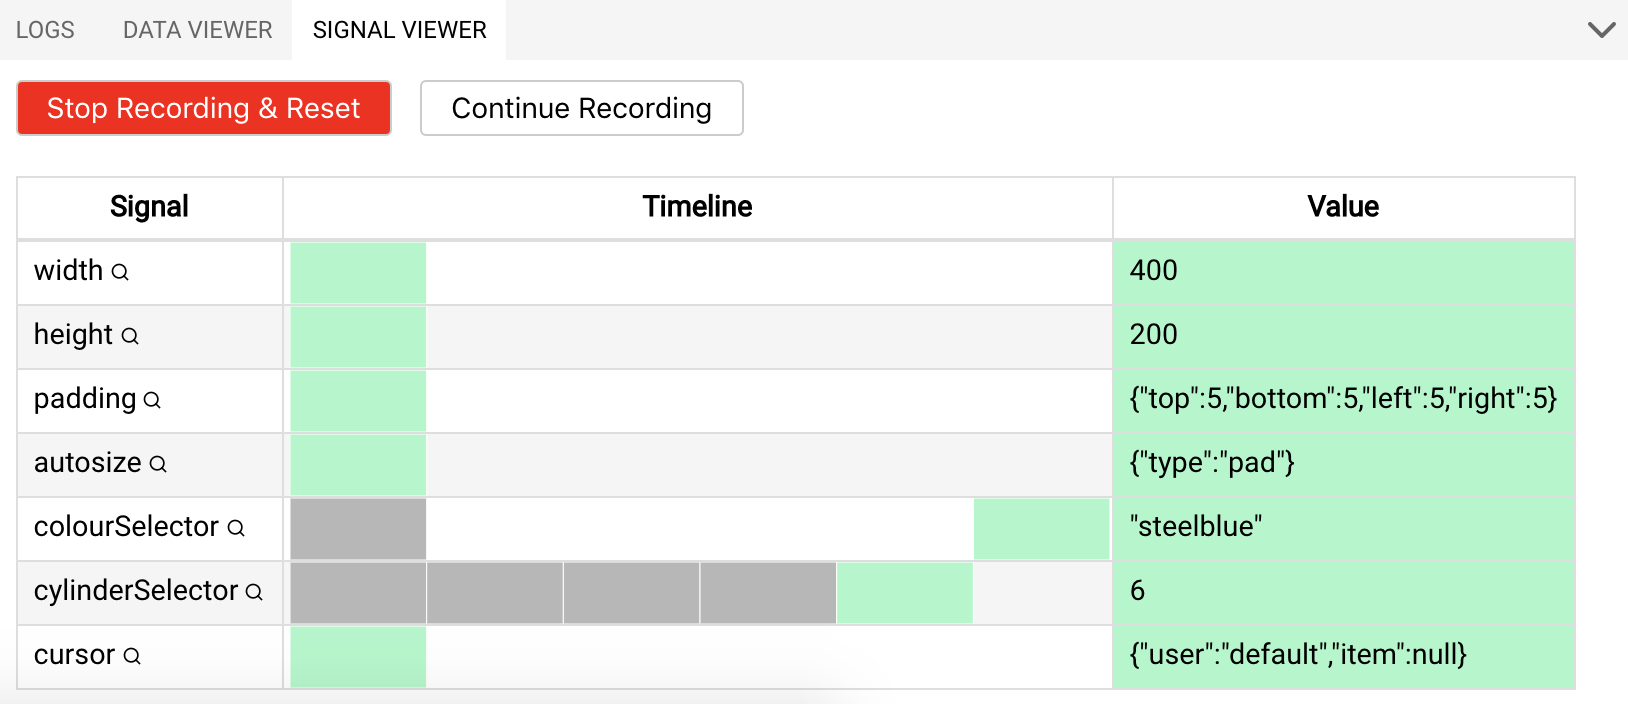
Exercise - Go back to the exercise where you let the size of the points be dependent upon the horizontal position of the mouse. Investigate what happens when recording the signals and hovering over the recording and clicking on some of the grey boxes.