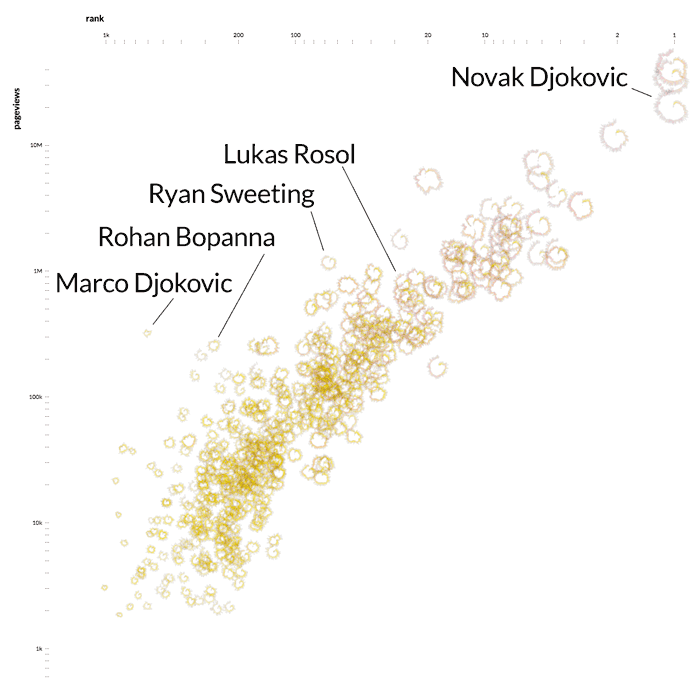
In your project you might want to generate custom visual encodings for datapoints, for example similar to what Kim Albrecht did in Untangling Tennis: this shows a scatterplot where each point is not a simple circle or square, but is actually a plot in itself.
We can do this in vega as well using transforms…
Back in the section where you changed the attributes of a static plot, one of the exercises asked you to use a square instead of a circle for a datapoint. This could be done by using "shape": "square" inside of the encoding. Here’s the small example (notice the shape in the encoding):
{
  "$schema": "https://vega.github.io/schema/vega/v5.json",
  "width": 400,
  "height": 200,
  "padding": 5,

  "data": [
    {
      "name": "table",
      "values": [
        {"x": 15, "y": 8},
        {"x": 72, "y": 25},
        {"x": 35, "y": 44},
        {"x": 44, "y": 29}
      ]
    }
  ],

  "scales": [
    {
      "name": "xscale",
      "domain": {"data": "table", "field": "x"},
      "range": "width"
    },
    {
      "name": "yscale",
      "domain": {"data": "table", "field": "y"},
      "range": "height"
    }
  ],

  "marks": [
    {
      "type": "symbol",
      "from": {"data":"table"},
      "encode": {
        "enter": {
          "x": {"scale": "xscale", "field": "x"},
          "y": {"scale": "yscale", "field": "y"},
          "shape": {"value": "square"},
          "fillOpacity": {"value": 0.5}
        }
      }
    }
  ]
}
If you check the documentation for a symbol here you’ll see that all kinds of shapes are possible: square, arrow, triangle-left, etc. Importantly for creating custom designs, this shape can also be an SVG path.
Hard-coding the SVG path
We’re not going into an in-depth explanation of a path here, but just give the basics. A path is a string, which tells a pen that you put on the screen how to move. For example:
- jump to point [15,2]
- draw 2 to the left
- draw 3 down
- draw a line to point [7,5]
To write this as an SVG path, we say what to do first and then how much for each step. In the case above: “move”, “15,2”, “horizontal”, “-2”, “vertical”, “3”, “move”, “7,5”. In SVG path this becomes: M15,2H-2V3M7,5. This string we can use as a shape.
Here’s the same plot as above, but the shape is changed to:
...
"shape": {"value": "M0,0H5V5Z"},
...
Calculating an SVG path
Let’s use a more interesting shape: M0,0Q0,-10,10,0 which is a quadratic curve (see the SVG path documentation).
In the example above, each point has the same (in this case: triangular) shape. With custom design, we want to have each shape defined by the datapoint itself. We can do this with transforms.
In a first step, let’s put the shape string in a transform, not the mark encoding.
...
"data": [
  {
    "name": "table",
    "values": [
      {"x": 15, "y": 8},
      {"x": 72, "y": 25},
      {"x": 35, "y": 44},
      {"x": 44, "y": 29}
    ],
    "transform": [
      {"type": "formula",
       "expr": "'M0,0Q0,-10,10,0'",
       "as": "my_shape"}
    ]
  }
],
...
This creates a new property of each datapoint, called my_shape. Check the data viewer to see if this is correct. Note that we have to put the expr string within single quotes inside the double quotes, otherwise vega will try to parse the string. So it’s "'M1,8Q9.5,1,18,8'", not "M1,8Q9.5,1,18,8". As we created this transform, we can replace the value in the encoding with this new field:
...
"shape": {"field": "my_shape"},
...
The result looks like this:
Finally, we can incorporate data features into the my_shape expression, like so:
...
"data": [
  {
    "name": "table",
    "values": [
      {"x": 15, "y": 8},
      {"x": 72, "y": 25},
      {"x": 35, "y": 44},
      {"x": 44, "y": 29}
    ],
    "transform": [
      {"type": "formula",
       "expr": "'M0,0Q0,-' + datum['x'] + ',' + datum['y'] + ',0'",
       "as": "my_shape"}
    ]
  }
],
...
The only thing that happens here, is that we replace some parts of the expr string with a field in the data itself. The final image looks like this:
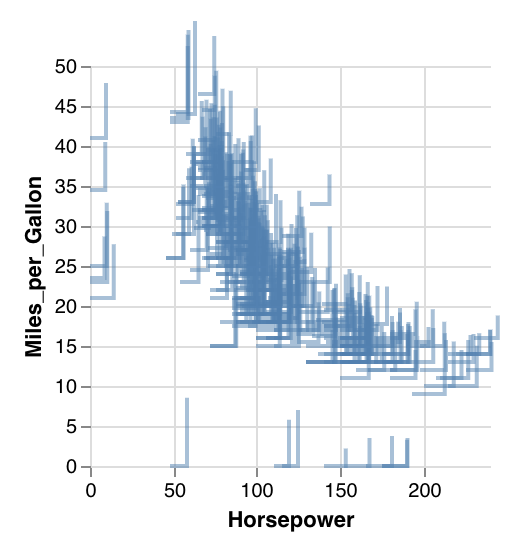
Exercise - As a proof-of-principle, try to recreate something similar to this image, where shape of the marks themselves depend on the number of cylinders and the acceleration. It can be any other shape you want, but make it dependent on these two.