Scales (see their documentation here) convert data from the original domain to a range that can be used for plotting. For example, imagine you have longitude data from a map. Locations on the earth have a longitude that is between -180 and 180. We want to plot this on a graph that is 800 pixels wide. If we’d just use the longitude for the x value, than any location west of Greenwich would be outside of the plot (because smaller than zero), and most of the right of the graphic would be empty (because there are no points in the range -180 to 800). We need to recalculate the positions: -180 (degrees) needs to become 0 (pixels), 0 (degrees) needs to become 400 (pixels) and 180 (degrees) needs to become 800 (pixels).
Example data:
{"name": "Thigpen", "city": "Bay Springs", "state": "MS", "country": "USA", "lat": 31.95376472, "long": -89.23450472}
{"name": "Livingston Municipal", "city": "Livingston", "state": "TX", "country": "USA", "lat": 30.68586111, "long": -95.01792778}
{"name": "Meadow Lake", "city": "Colorado Springs", "state": "CO", "country": "USA", "lat": 38.94574889, "long": -104.5698933}
{"name": "Perry-Warsaw", "city": "Perry", "state": "NY", "country": "USA", "lat": 42.74134667, "long": -78.05208056}
{"name": "Hilliard Airpark", "city": "Hilliard", "state": "FL", "country": "USA", "lat": 30.6880125, "long": -81.90594389}
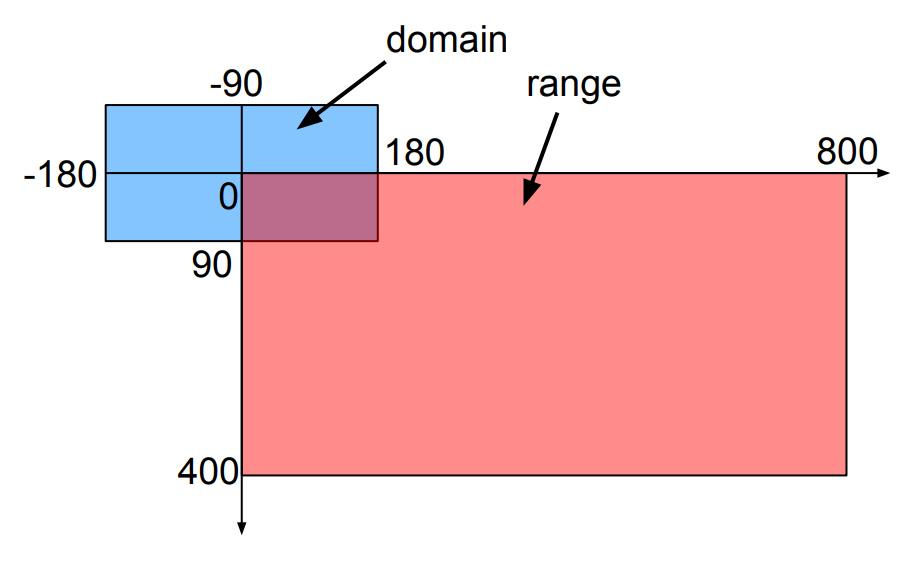
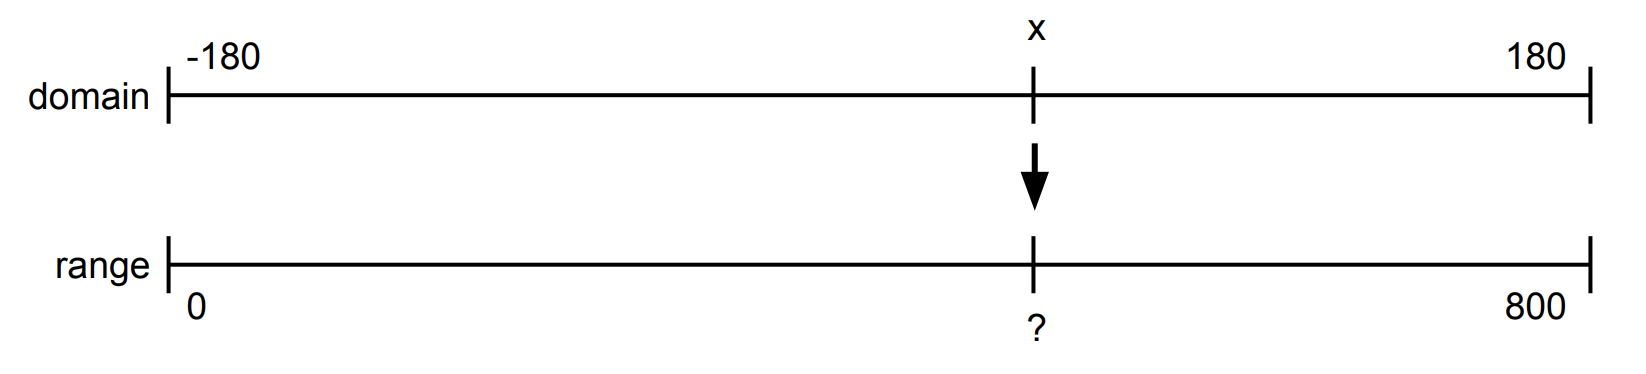
The most important keys for a scale are its domain and its range. The domain is the original space; the range is the target range. In the case of the longitude data:
A scale also needs to have a name so that it can be referenced later. This is what the most simple scale for the conversion of looks like:
{
  "name": "myscale",
  "type": "linear",
  "domain": [-180,180],
  "range": [0,800]
},
The linear type of scale interpolates the target value linearly. The domain provides the minimum and maximum values of the source values; the range provides the minimum and maximum of the target values. To use this scale, we reference it in the encoding: "x": {"scale": "myscale", "field": "longitude"}.
Instead of providing a minimum and maximum value for domain or range, we can also provide just a single number which is then considered the maximum. This is what you see in the example above for xscale: "range": "width".
Different types of scales exist, including linear, sqrt, ordinal etc. See the documentation at https://vega.github.io/vega/docs/scales/#types for a full reference.
Scales are not only interesting for recalculating ranges, but they are used to assign colours to categories as well. We’ll come back to those later.