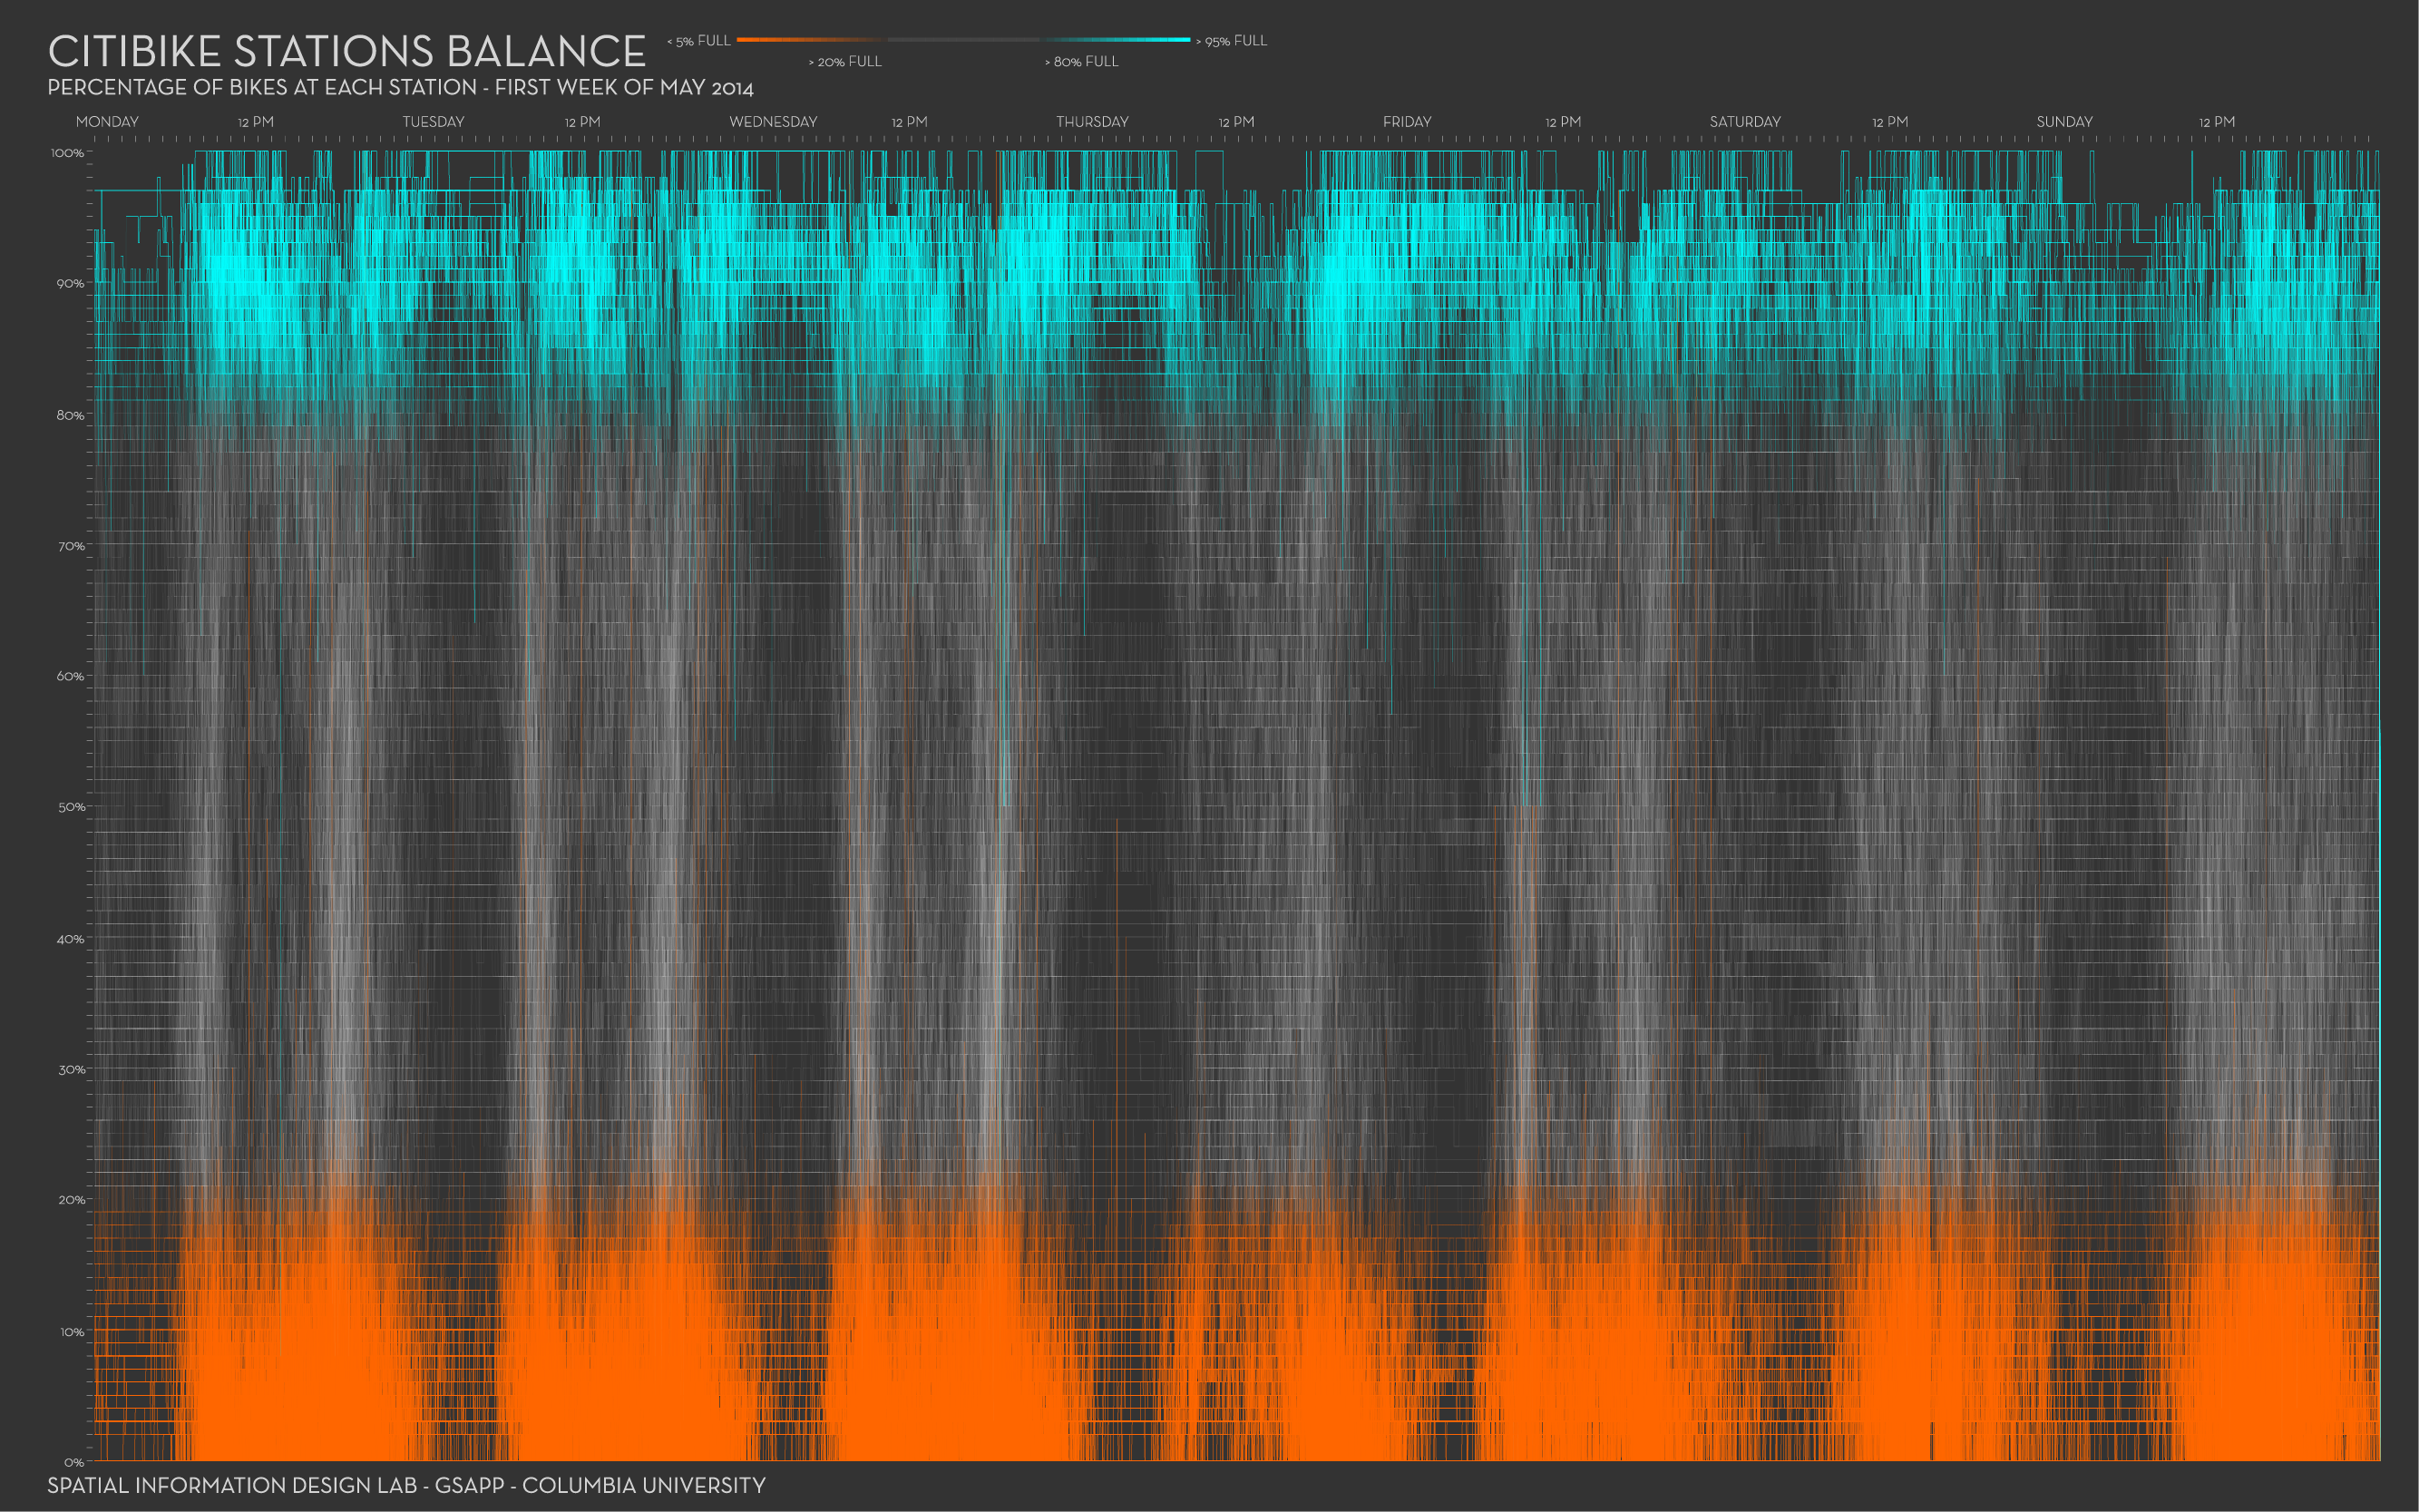
For the exercises below and similar to the further exercises for vega-lite, we will use the New York City citibike data available from https://www.citibikenyc.com/system-data. Some great visuals by Juan Francisco Saldarriaga can inspire you.
We made a (small) part of the data available here. It concerns trip data from November 2011, where the trip started or ended in station nr 336. The fields in each record (with example data) look like this:
{
  "tripduration": 1217,
  "starttime": "2019-11-01 06:03:28.5390",
  "stoptime": "2019-11-01 06:23:45.9810",
  "startstation_id": 3236,
  "startstation_name": "W 42 St & Dyer Ave",
  "startstation_latitude": 40.75898481399634,
  "startstation_longitude": -73.99379968643188,
  "endstation_id": 336,
  "endstation_name": "Sullivan St & Washington Sq",
  "endstation_latitude": 40.73047747,
  "endstation_longitude": -73.99906065,
  "bikeid": 41025,
  "usertype": "Subscriber",
  "birthyear": 1964,
  "gender": 1
}
Exercise 1 - Citibike Station Dial
One of the plots on that website is the Citibike Station Dial shown here.
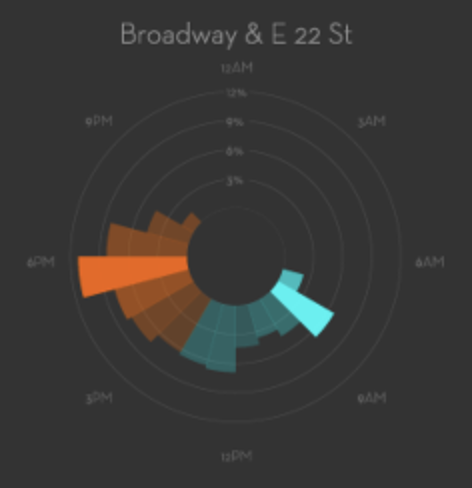

We’ve made a similar plot for station 336 which looks like this.
Exercise: Go through the code below, and see if you can understand what everything does. Tip: it’s best to start going through the marks and look up any scales and transforms used as you go, instead of starting with the transforms.
{
    "$schema": "https://vega.github.io/schema/vega/v5.json",
    "background": "#333",
    "width": 400,
    "height": 400,
    "data": [
      {
        "name": "table",
        "url": "https://raw.githubusercontent.com/vda-lab/vda-lab.github.io/master/assets/station_366.json",
        "transform": [
          {
            "type": "formula",
            "as": "hour",
            "expr": "hours(datum.starttime)"
          },
          {
            "type": "formula",
            "as": "from-or-to",
            "expr": "datum.endstation_id == 336 ? 1 : -1"
          },
          {
            "type": "aggregate",
            "fields": ["from-or-to"],
            "ops": ["sum"],
            "groupby": ["hour"],
            "as": ["balance"]
          },
          {
            "type": "formula",
            "as": "abs_balance",
            "expr": "abs(datum.balance)"
          },
          {
            "type": "formula",
            "as": "hour_plus1",
            "expr": "datum.hour + 1"
          },
          {
            "type": "formula",
            "as": "half_width",
            "expr": "width/2"
          },
          {
            "type": "formula",
            "as": "half_height",
            "expr": "height/2"
          },
          {
            "type": "formula",
            "as": "hour_plus1",
            "expr": "datum.hour + 1"
          },
          {
            "type": "formula",
            "as": "tooltip_text",
            "expr": "'Hour: ' + toString(datum.hour) + ' ; Balance: ' + toString(datum.balance)"
          },
          {
            "type": "formula",
            "as": "slice_angle",
            "expr": "(2*PI)/24"
          },
          {
            "type": "formula",
            "as": "text_x",
            "expr": "200+100*cos(datum.slice_angle*datum.hour_plus1 - PI/2 - (datum.slice_angle/2))"
          },
          {
            "type": "formula",
            "as": "text_y",
            "expr": "200+100*sin(datum.slice_angle*datum.hour_plus1 - PI/2 - (datum.slice_angle/2))"
          }
        ]
      }
    ],
    "scales": [
      {
        "name": "rScale",
        "type": "linear",
        "domain": {"data": "table", "field": "abs_balance"},
        "range": [20,180]
      },
      {
        "name": "thetaScale",
        "type": "linear",
        "domain": {"data": "table", "field": "hour"},
        "range": [0, 6]
      },
      {
        "name": "opacityScale",
        "type": "linear",
        "domain": {"data": "table", "field": "abs_balance"},
        "range": [0.1, 1]
      },
      {
        "name": "colourScale",
        "type": "linear",
        "domain": {"data": "table", "field": "balance"},
        "range": {"scheme": "redyellowgreen"}
      }
    ],
    "marks": [
      {
        "type": "arc",
        "from": {"data":"table"},
        "encode": {
          "enter": {
            "startAngle": {"field": "hour", "scale": "thetaScale"},
            "endAngle": {"field": "hour_plus1", "scale": "thetaScale"},
            "innerRadius": {"value": 20},
            "outerRadius": {"field": "abs_balance", "scale": "rScale"},
            "x": {"field": "half_width"},
            "y": {"field": "half_height"},
            "tooltip": {"field": "tooltip_text"}
          },
          "update": {
            "fill": {"field": "balance", "scale": "colourScale"},
            "fillOpacity": {"field": "abs_balance", "scale": "opacityScale"}
          },
          "hover": {
            "fill": {"value": "lightblue"},
            "fillOpacity": {"value": 1}
          }
        }
      },
      {
        "type": "text",
        "from": {"data": "table"},
        "encode": {
          "enter": {
            "text": {"field": "hour_plus1"},
            "x": {"field": "text_x"},
            "y": {"field": "text_y"},
            "align": {"value":"center"},
            "baseline": {"value": "middle"},
            "fontSize": {"value": 10},
            "fill": {"value": "white"}
          }
        }
      },
      {
        "type": "rule",
        "encode": {
          "enter": {
            "x": {"value": 200},
            "y": {"value": 20},
            "x2": {"value": 200},
            "y2": {"value": 380},
            "stroke": {"value": "lightgrey"}
          }
        }
      },
      {
        "type": "rule",
        "encode": {
          "enter": {
            "x": {"value": 20},
            "y": {"value": 200},
            "x2": {"value": 380},
            "y2": {"value": 200},
            "stroke": {"value": "lightgrey"}
          }
        }
      },
      {
        "type": "text",
        "encode": {
          "enter": {
            "text": {"value": ["Balance in bike","pickup/dropoff","for station 336"]},
            "x": {"value": 20},
            "y": {"value": 20},
            "align": {"value":"left"},
            "baseline": {"value": "middle"},
            "fontSize": {"value": 20},
            "fill": {"value": "white"}
          }
        }
      },
      {
        "type": "text",
        "encode": {
          "enter": {
            "text": {"value": ["green = more pickups than dropoffs","red = more dropoffs than pickups"]},
            "x": {"value": 220},
            "y": {"value": 380},
            "align": {"value":"left"},
            "baseline": {"value": "middle"},
            "fontSize": {"value": 10},
            "fill": {"value": "white"}
          }
        }
      }
    ]
  }