Let’s start with a node-link diagram for a network. We’ll use the miserables dataset for this.
Minimal network
Here’s a minimal vega specification, without colours or dragging:
{
"$schema": "https://vega.github.io/schema/vega/v5.json",
"width": 350,
"height": 250,
"padding": 0,
"autosize": "none",
"signals": [
{ "name": "cx", "update": "width / 2" },
{ "name": "cy", "update": "height / 2" }
],
"data": [
{
"name": "node-data",
"url": "https://raw.githubusercontent.com/vega/vega-datasets/master/data/miserables.json",
"format": {"type": "json", "property": "nodes"}
},
{
"name": "link-data",
"url": "https://raw.githubusercontent.com/vega/vega-datasets/master/data/miserables.json",
"format": {"type": "json", "property": "links"}
}
],
"marks": [
{
"name": "nodes",
"type": "symbol",
"zindex": 1,
"from": {"data": "node-data"},
"encode": {
"enter": {
"fill": {"value": "grey"}
}
},
"transform": [
{
"type": "force",
"iterations": 300,
"velocityDecay": 0.4,
"forces": [
{"force": "center", "x": {"signal": "cx"}, "y": {"signal": "cy"}},
{"force": "collide", "radius": 5},
{"force": "nbody", "strength": -10},
{"force": "link", "links": "link-data", "distance": 15}
]
}
]
},
{
"type": "path",
"from": {"data": "link-data"},
"interactive": false,
"encode": {
"update": {
"stroke": {"value": "lightgrey"},
"strokeWidth": {"value": 0.5}
}
},
"transform": [
{
"type": "linkpath", "shape": "line",
"sourceX": "datum.source.x", "sourceY": "datum.source.y",
"targetX": "datum.target.x", "targetY": "datum.target.y"
}
]
}
]
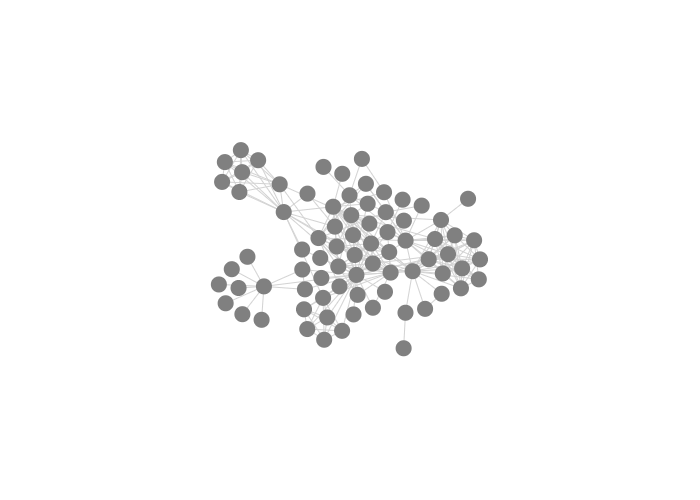
}This is what the plot looks like:
Let’s break this down:
data: If you follow the URL to the JSON file, you’ll see that it looks like this:{nodes: [], links: []}. We create two different datasets: one for the nodes and one for the links. Theformat.propertybit specifies which part needs to be extracted. It would seem that we’d be able to do this using a single dataset and creating two derived ones usingsource, but unfortunately it’s not possible to extract a single element using a transform.marks: There are two types of marks, namely for the nodes and for the edges. In principle, you can draw the nodes without the edges (try it), but not the other way around because the edge positions depend on the source and target nodes.- For the nodes, everything is the same as we saw in all our previous exercises, except for the
zindexandtransform. The"zindex": 1makes sure that the nodes are drawn on top of the edges.transform: Definitely have a good look at the documentation for this. We use a single transform of typeforce. Actually, it’s not just one force, but several which we list under"forces": []. The algorithm will try to find an equilibrium between all of these interacting forces.center: Indicates what the center of the plot should be. This would typically be the center of your screen, i.e.width/2andheight/2.collide: To what extent should nodes be pushed apart, but only when they overlap.nbody: To what extent should nodes be pushed apart or attracted. A negative value will push them apart; a positive one will pull them together. This value will have the largest impact on what your plot looks like.link: Whilenbodywill push nodes apart or attract them, this is contrained by the links between them.
- For the links, we use
pathmarks instead oflinebecause the first can have arbitrary position, while lines are used for longitudinal data.- We set
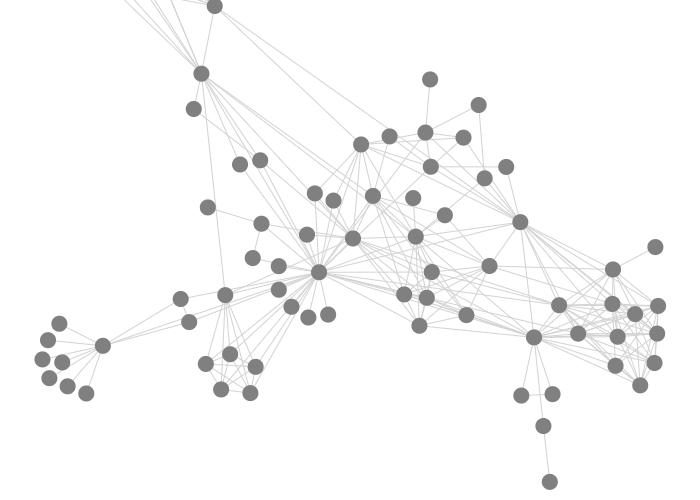
strokeandstrokeWidthin anupdatesection instead ofenter. If we’d use enter, the paths wouldn’t update when the nodes move around. You’d get a picture like this instead: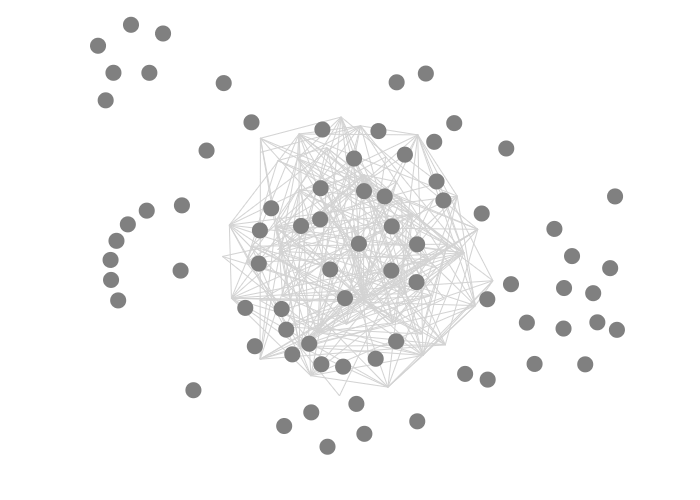
transform: We use the speciallinkpathtransform, which is specifically for drawing a path between a source and a target. Apart fromline, theshapecan also be acurve,arc,diagonalororthogonal. Try these out as well.
- We set
- For the nodes, everything is the same as we saw in all our previous exercises, except for the
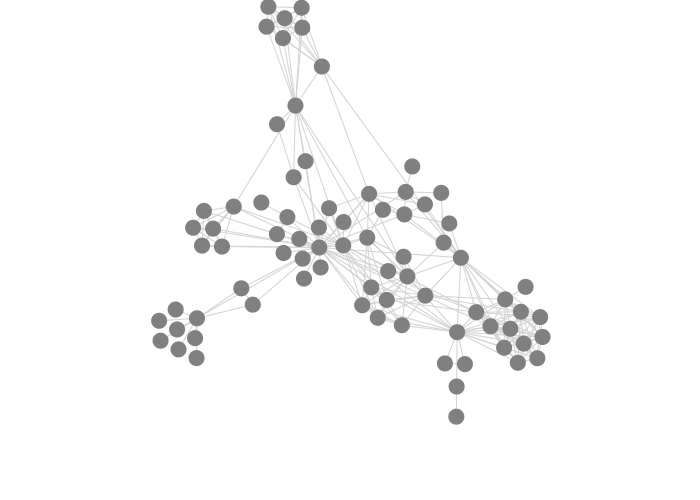
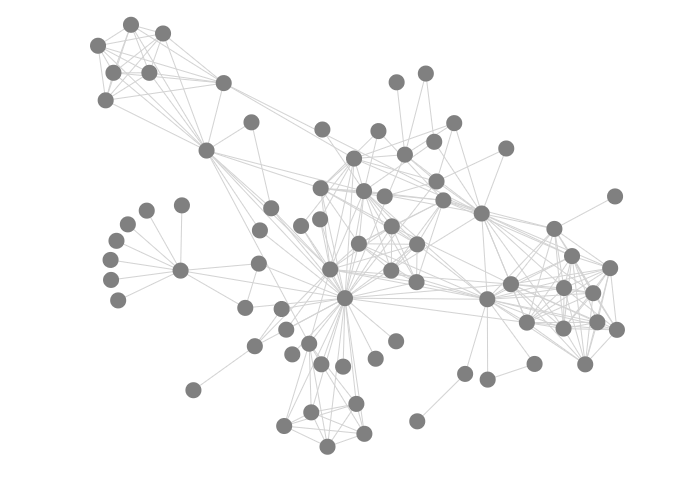
Here are some examples of plots with different settings for collide, nbody and link in the node transform:
Altering collide, with nbody equal to -10 and link equal to 15:
1 |
5 |
10 |
|---|---|---|
 |
 |
 |
Altering nbody, with collide equal to 5 and link equal to 15:
-2 |
-10 |
-20 |
|---|---|---|
 |
|
 |
Altering link, with collide equal to 5 and nbody equal to -10:
5 |
15 |
30 |
|---|---|---|
 |
|
 |
Exercise - What happens if you change the value of nbody to 1? Or to 10? Does the value of collide have an effect? If so: what effect?
Adding node dragging
Here’s an example where we can drag nodes around. It looks complex, but all should become clear when we break this example down.
{
  "$schema": "https://vega.github.io/schema/vega/v5.json",
  "width": 400,
  "height": 275,
  "padding": 0,
  "autosize": "none",

  "signals": [
    { "name": "cx", "update": "width / 2" },
    { "name": "cy", "update": "height / 2" },
    {
      "description": "State variable for active node dragged status.",
      "name": "dragged", "value": 0,
      "on": [
        {
          "events": "symbol:mouseout[!event.buttons], window:mouseup",
          "update": "0"
        },
        {
          "events": "symbol:mouseover",
          "update": "dragged || 1"
        },
        {
          "events": "[symbol:mousedown, window:mouseup] > window:mousemove!",
          "update": "2", "force": true
        }
      ]
    },
    {
      "description": "Graph node most recently interacted with.",
      "name": "dragged_node", "value": null,
      "on": [
        {
          "events": "symbol:mouseover",
          "update": "dragged === 1 ? item() : dragged_node"
        }
      ]
    },
    {
      "description": "Flag to restart Force simulation upon data changes.",
      "name": "restart", "value": false,
      "on": [
        {"events": {"signal": "dragged"}, "update": "dragged > 1"}
      ]
    }
  ],

  "data": [
    {
      "name": "node-data",
      "url": "https://raw.githubusercontent.com/vega/vega-datasets/master/data/miserables.json",
      "format": {"type": "json", "property": "nodes"}
    },
    {
      "name": "link-data",
      "url": "https://raw.githubusercontent.com/vega/vega-datasets/master/data/miserables.json",
      "format": {"type": "json", "property": "links"}
    }
  ],

  "marks": [
    {
      "name": "nodes",
      "type": "symbol",
      "zindex": 1,

      "from": {"data": "node-data"},
      "on": [
        {
          "trigger": "dragged",
          "modify": "dragged_node",
          "values": "dragged === 1 ? {fx:dragged_node.x, fy:dragged_node.y} : {fx:x(), fy:y()}"
        },
        {
          "trigger": "!dragged",
          "modify": "dragged_node", "values": "{fx: null, fy: null}"
        }
      ],

      "encode": {
        "enter": {
          "fill": {"value": "grey"}
        },
        "update": {
          "size": {"value": 50},
          "cursor": {"value": "pointer"}
        }
      },

      "transform": [
        {
          "type": "force",
          "iterations": 300,
          "velocityDecay": 0.4,
          "restart": {"signal": "restart"},
          "static": false,
          "forces": [
            {"force": "center", "x": {"signal": "cx"}, "y": {"signal": "cy"}},
            {"force": "collide", "radius": 5},
            {"force": "nbody", "strength": -10},
            {"force": "link", "links": "link-data", "distance": 15}
          ]
        }
      ]
    },
    {
      "type": "path",
      "from": {"data": "link-data"},
      "interactive": false,
      "encode": {
        "update": {
          "stroke": {"value": "lightgrey"}
        }
      },
      "transform": [
        {
          "type": "linkpath", "shape": "line",
          "sourceX": "datum.source.x", "sourceY": "datum.source.y",
          "targetX": "datum.target.x", "targetY": "datum.target.y"
        }
      ]
    }
  ]
}
Here is the result (drag one of the nodes):
What has changed?
- A signal
draggedcaptures if anything is dragged. Possible values are:0(nothing is being dragged),1(on mouseover: something could be dragged) and2(something is actually being dragged). - A signal
dragged_node, which is a container for the actual node being dragged. If the value ofdraggedis1(i.e. ready to drag, but not actually dragging yet), the value fordragged_nodewill be set toitem(), which is the element on which an event is active (see here). Why do we actually check for the value ofdragged? If you don’t and start dragging a node across another one, it might happen that your mouse picks up the other node than the original one on the way. - A signal
restartto ensure that positions of the nodes are recalculated when we drag a node to a new position. Now how does the code{"events": {"signal": "dragged"}, "update": "dragged > 1"}actually work? The signal will fire every time thedraggedsignal changes. Itsupdateisdragged > 1.dragged > 1is a test: it returnstrueorfalse. It is thistrueorfalsethat will be stored in the symbolrestart. - A trigger
draggedon the nodes changes thedragged_node’sfxandfy.fxandfyare two special fields on a node object, and stand for fixed x and fixed y. Ifdragged === 1(i.e. the mouse hovers over the node),fxis set to thex-position ofdragged_nodeandfyaccordingly. This is so that the node stays in a fixed position while you’re on top of it and does not escape from under the mouse. Ifdraggedis not1(i.e. it’s2),fxandfyare set tox()andy()which are the x- and y-position of the mouse. So as your mouse moves around, the node will follow. - A trigger
!dragged, which stands for not dragged. When the signaldraggedis set to 0,fxandfyare set tonull, meaning that the node can participate again in all forces in the network.
Exercise - The individuals in the miserables data belong to different groups. Use these groups to set the colour of the nodes.
Exercise - Create two plots next to each other: one with this network, and one with a histogram of the number of individuals per group. So something like this: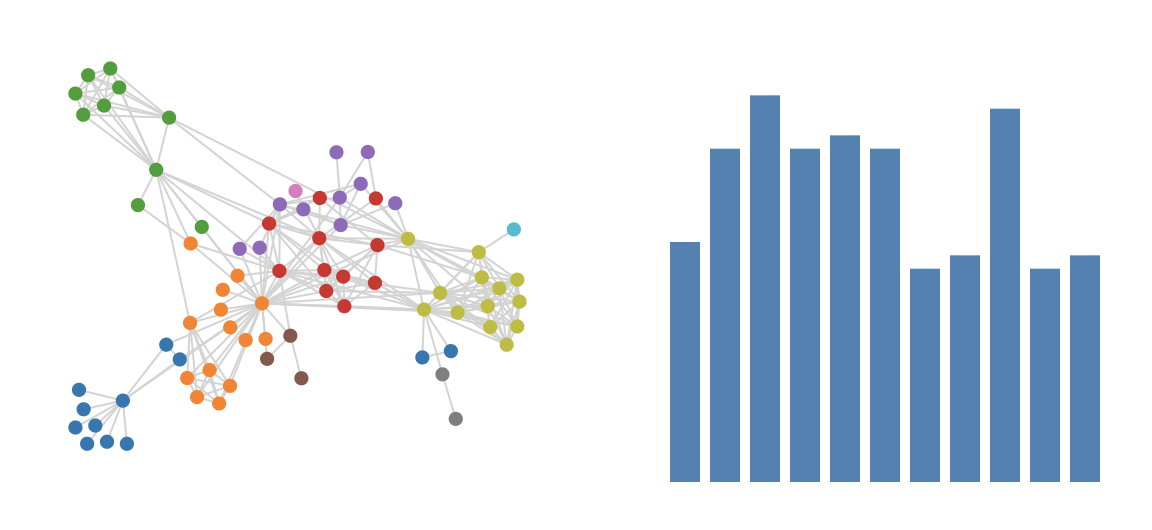
Extra points if you can give the bars the same colour as the nodes in the graph.