Another difference that we see with vega-lite is the use of the enter tag. This is a very important concept that directly drills down into D3 which is the javascript library underneath vega. To understand the concept, we need to make a clear distinction between marks on the screen, and the data underneath.
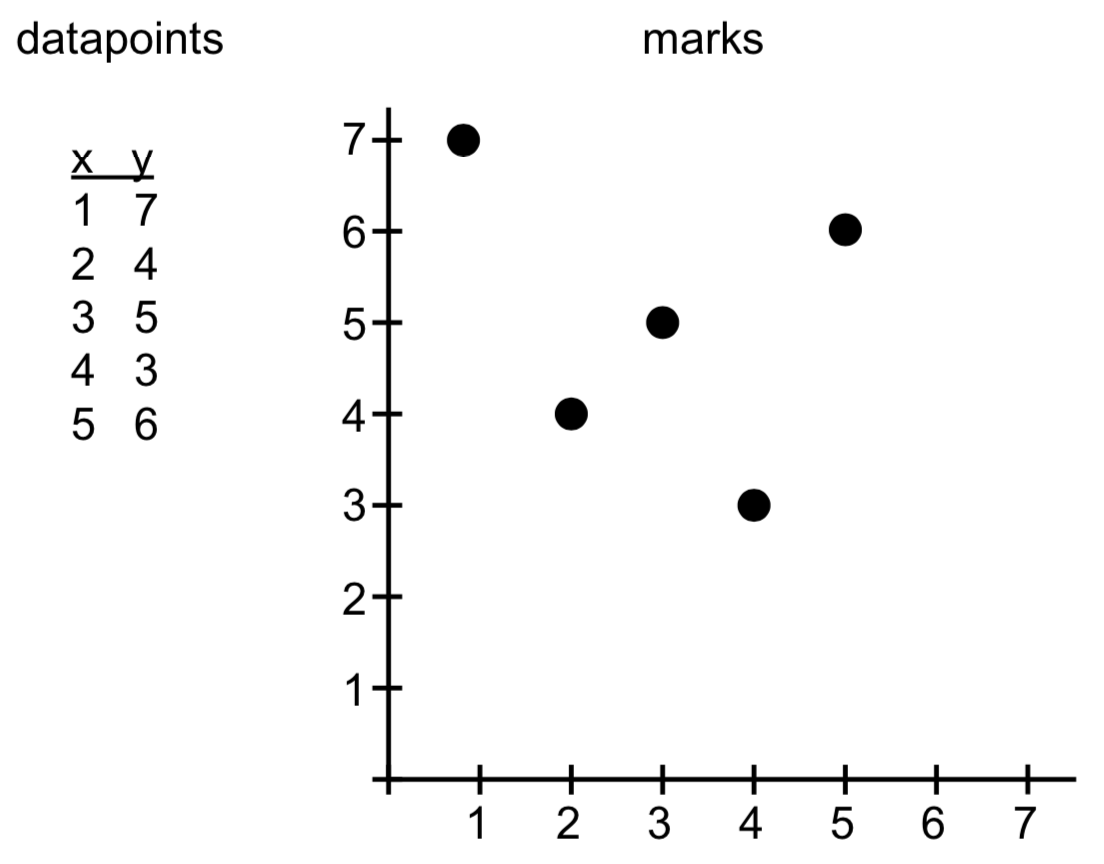
For the explanation below, take the initial state of 5 datapoints represented as 5 marks.
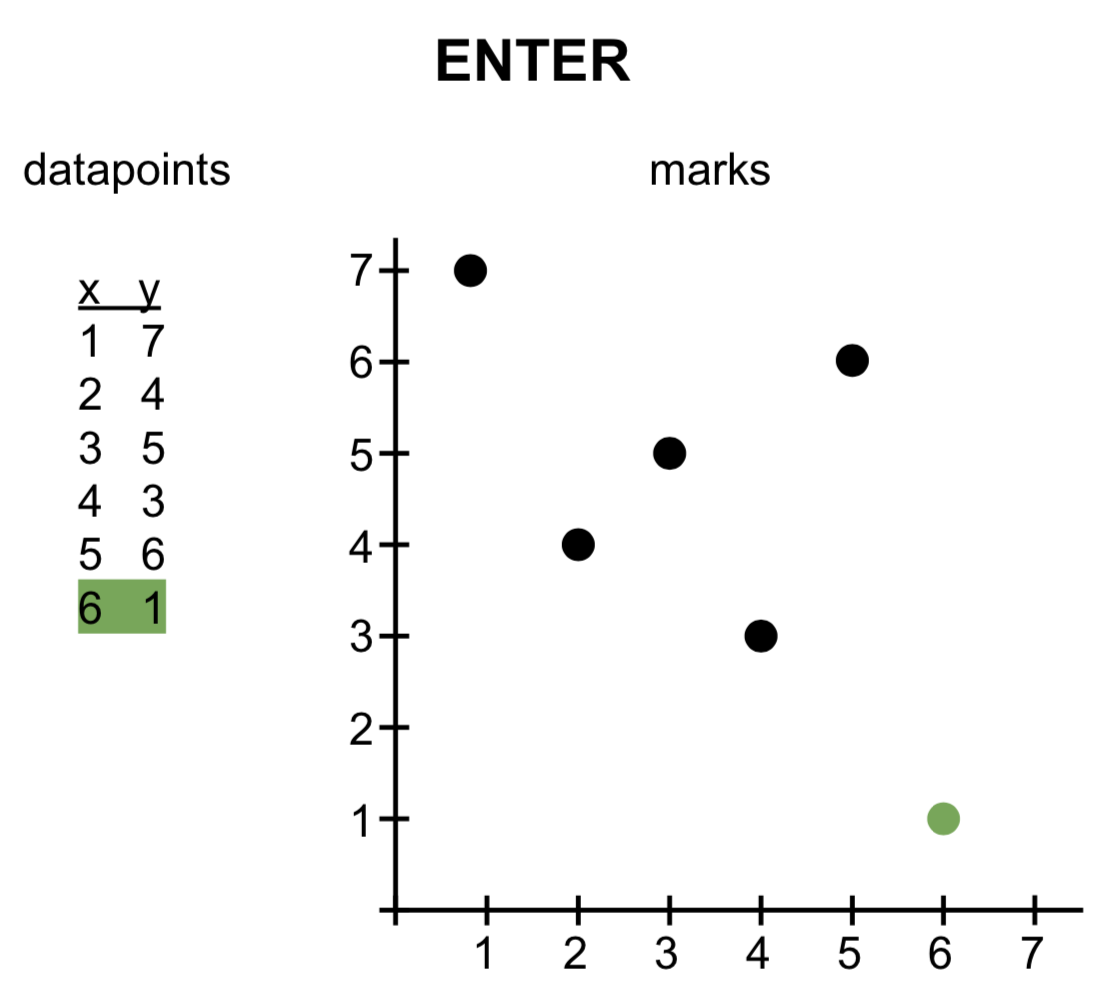
Enter
The enter pragma applies when there are more datapoints than marks on the screen. In the image below, a new datapoint [6,1] is created, for which no mark exists yet. The visual encoding that should be applied to that datapoint is defined in the encoding -> enter section.
Update
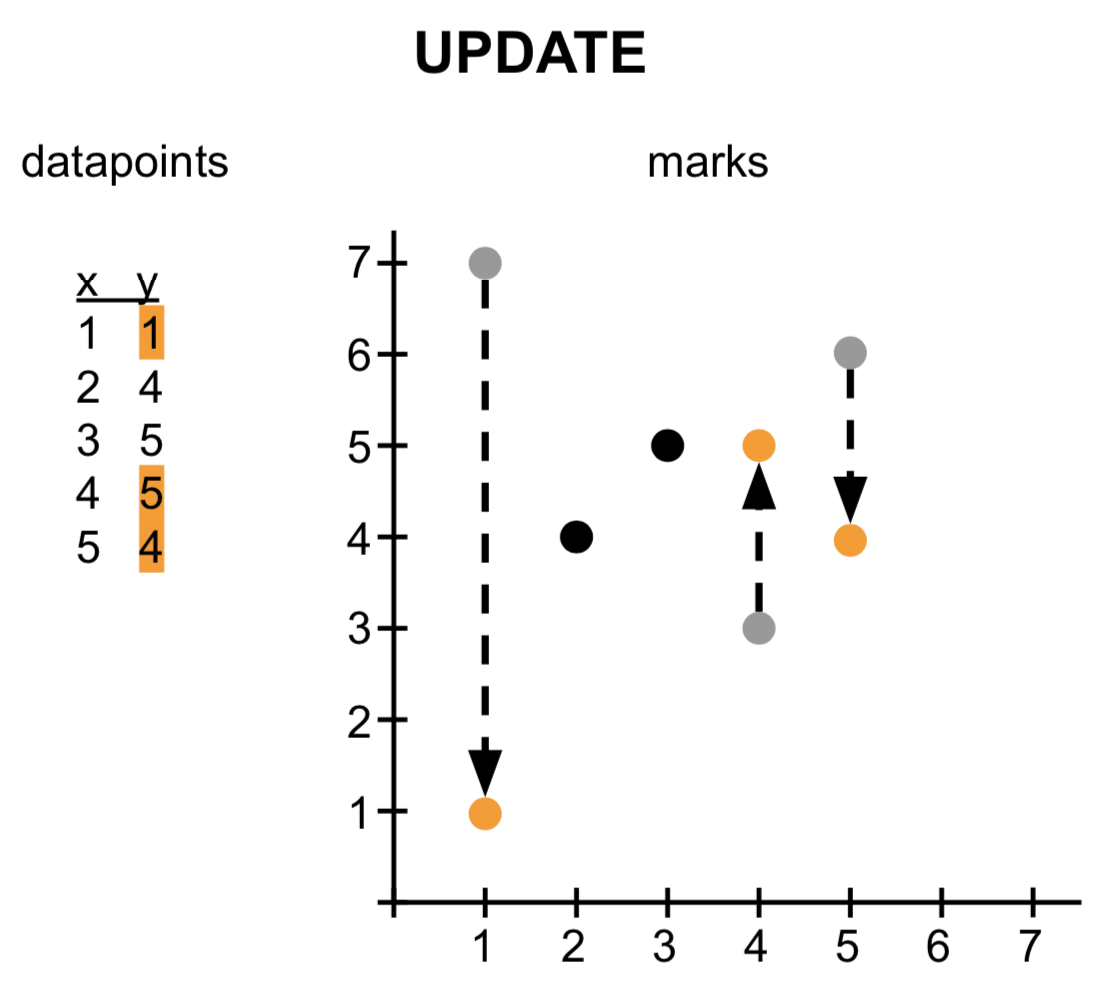
Now let’s change the value some of the datapoints. When the number of marks does not have to change, but they do not represent the correct data anymore, we apply an update (specified in the encoding -> update section). In the image below, it is the y-position that changed, but that might also be color, shape, size, etc of the mark.
Exit
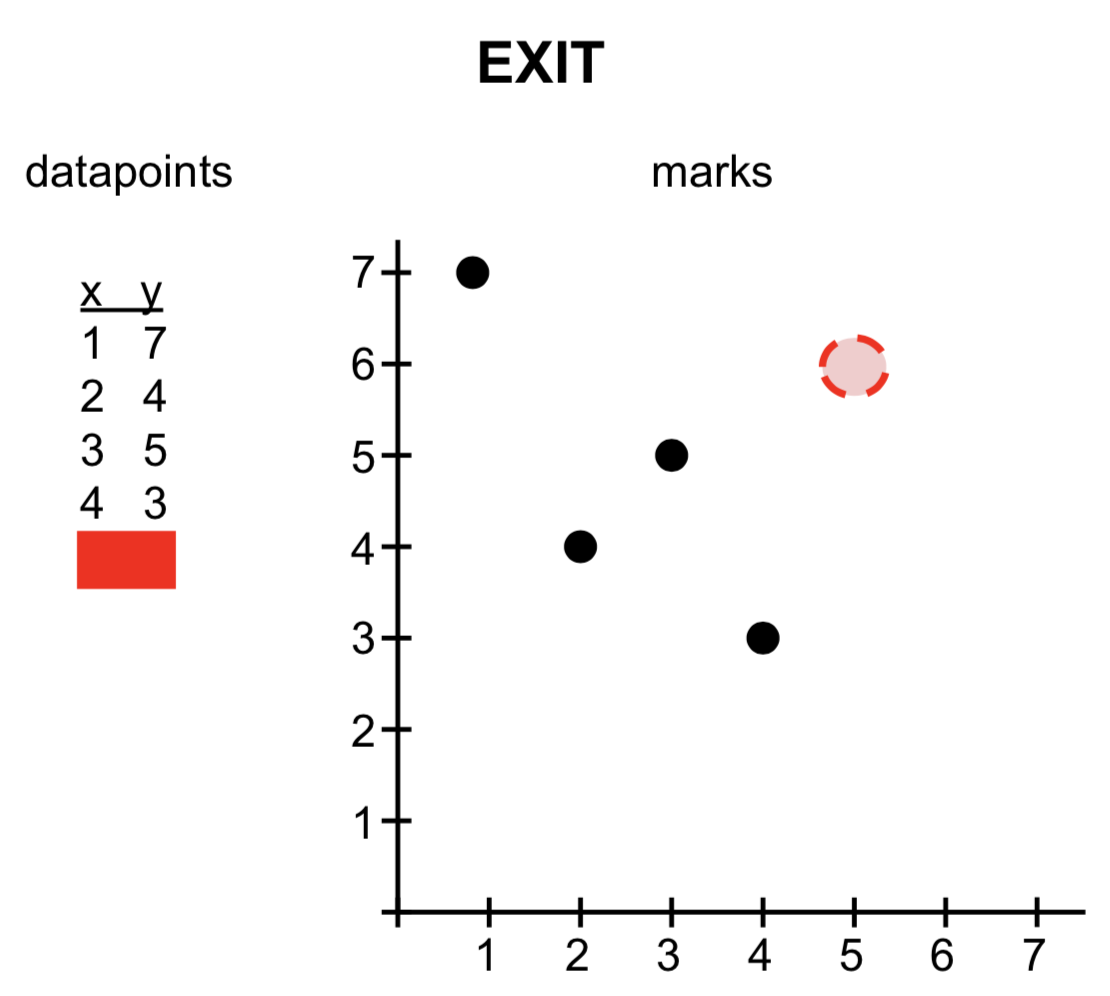
If after a change in the data there are more marks on the screen than necessary for showing the data (e.g. we go from 5 datapoints to 4), what should happen with the one mark that is still on the screen? It’ll be left hanging, unless we actually remove it. That is what the encoding -> exit section is for.
In the scatterplots above, only the enter is provided, because this is a static dataset that does not change over time (not even changing colour on hover). In other words: we start with a dataset with n datapoints, but no marks yet on the screen. Hence we need the enter.
We’ll be using update later when looking at interactive visualisations.