Sometimes we’ll want to do some calculations on the data before we actually visualise them. For example, we want to make a barchart that shows the average miles per gallon for each number of cylinders.
To do this, we’ll have to add a transform part to our specification:
{
  "data": ...,
  "transform": ...,
  "mark": ...,
  "encoding": ...
}
There is extensive documentation available for these transforms at https://vega.github.io/vega-lite/docs/transform.html. Possible transformations that we can apply are: aggregate, bin, calculate, density, filter, flatten, fold, impute, join aggregate, lookup, pivot, quantile, regression and loess regression, sample, stack, time unit, and window.
Filtering
In the case of filtering, it is quite clear what will happen: only the objects that match will be displayed. We can for example show a barchart of acceleration only for those cars that have 5 or fewer cylinders. One of the problems that we run into, is that the specification needs to be in JSON format. To say that we only want cars with 5 or fewer cylinders, we’ll use "filter": {"field": "Cylinders", "lte": "5"}. The lte stands for “less than or equal to”. There is also:
equallt(less than)gt(great than)gte(greater than or equal to)rangeoneOf
{
  "$schema": "https://vega.github.io/schema/vega-lite/v4.json",
  "data": {
    "url": "https://raw.githubusercontent.com/vega/vega/master/docs/data/cars.json"
  },
  "transform": [
    {
      "filter": {"field": "Cylinders", "lte": "5"}
    }
  ],
  "mark": "bar",
  "encoding": {
    "x": {"field": "Cylinders", "type": "quantitative"},
    "y": {"field": "Acceleration", "type": "quantitative"},
    "size": {"value": 20}
  }
}
Another option is to use a filter like this: {"filter": "datum.Cylinders <= 5"} where datum stands for the single object, and .Cylinders will get the value for that property (“Cylinders” is capitalised in the data that we are loading, so we have to capitalise it here as well).
Both will give the following image:
A filter does not change the data objects itself. This is different for many other transformations. For example, we can calculate as well. For example, the “Year” attribute in each object is now a string, e.g. “1970-01-01”. It’d be good if this would be a number. We’ll need to look into vega expressions on how to do this here. There seem to be date-time functions, and it appears we can extract the year with year(datum.Year).
What does this do? This effectively adds a new field to each object, called yearonly. We can now use this new field as any other.
{
  "$schema": "https://vega.github.io/schema/vega-lite/v4.json",
  "data": {
    "url": "https://raw.githubusercontent.com/vega/vega/master/docs/data/cars.json"
  },
  "transform": [
      {"calculate": "year(datum.Year)", "as": "yearonly"}
  ],
  "mark": "point",
  "encoding": {
    "x": {"field": "Miles_per_Gallon", "type": "quantitative"},
    "y": {"field": "Acceleration", "type": "quantitative"},
    "color": {"field": "yearonly", "type": "ordinal"}
  }
}
Exercise - Create an image that plots the original Year versus the new yearonly.
Aggregation
So with calculations, we get an additional field. What if we want to aggregate? Let’s go back to our initial question: we want to have a barchart that shows the average miles per gallon for each number of cylinders. Below is the specification:
{
  "$schema": "https://vega.github.io/schema/vega-lite/v4.json",
  "data": {
    "url": "https://raw.githubusercontent.com/vega/vega/master/docs/data/cars.json"
  },
  "transform": [
    {
      "aggregate": [{
         "op": "mean",
         "field": "Acceleration",
         "as": "mean_acc"
      }],
      "groupby": ["Cylinders"]
    }
  ],
  "mark": "bar",
  "encoding": {
    "x": {"field": "Cylinders", "type": "quantitative"},
    "y": {"field": "mean_acc", "type": "quantitative"}
  }
}
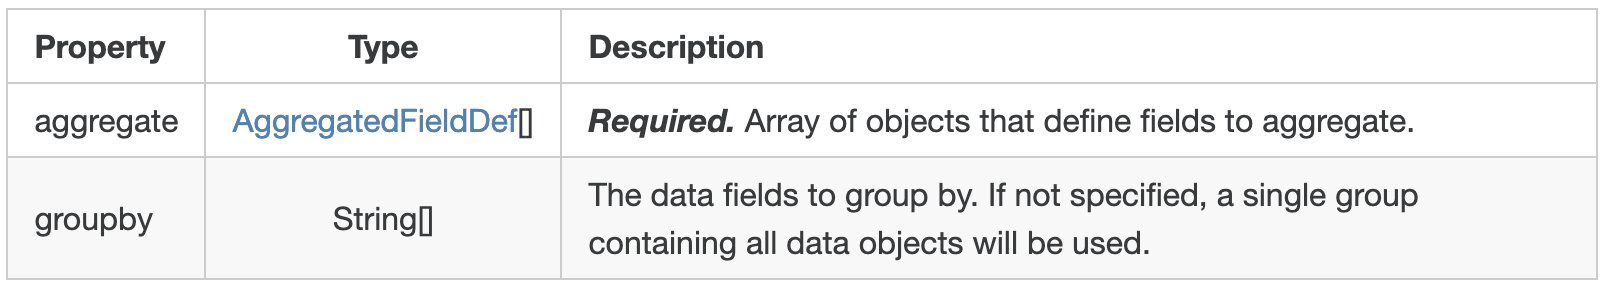
In the documentation, we see that aggregate takes a AggregatedFieldDef[], and groupby takes a String[]. The [] after each of these indicates that they should be arrays, not single values. That is why we use "aggregate": [{...}] instead of "aggregate": {...} and "groupby": ["Cylinders"] instead of "groupby": "Cylinders".
Exercise - See if you can create a plot that shows the mean acceleration per year. So you’ll have to combine two transforms to do this. Your output picture should look like this:
![]()
Binning
As another example, let’s create a histogram of the miles per gallon. Looking at the documentation at https://vega.github.io/vega-lite/docs/bin.html, it seems that the easiest way to do this is to do this in the encoding section:
{
  "$schema": "https://vega.github.io/schema/vega-lite/v4.json",
  "data": {
    "url": "https://raw.githubusercontent.com/vega/vega/master/docs/data/cars.json"
  },
  "mark": "bar",
  "encoding": {
    "x": {"bin": true, "field": "Miles_per_Gallon", "type": "quantitative"},
    "y": {"aggregate": "count", "type": "quantitative"}
  }
}
The only thing to do was to add "bin": true to the field that you want to bin, and "aggregate": "count" to the other dimension. However, this approach is not very flexible, and for any use that is not this straightforward you will have to define the binning as a transform instead, like this:
{
  "$schema": "https://vega.github.io/schema/vega-lite/v4.json",
  "data": {
    "url": "https://raw.githubusercontent.com/vega/vega/master/docs/data/cars.json"
  },
  "transform": [
    {"bin": true, "field": "Miles_per_Gallon", "as": "binned_mpg"}
  ],
  "mark": "bar",
  "encoding": {
    "x": {"field": "binned_mpg", "bin": {"binned": true,"step": 1},"type": "quantitative"},
    "x2": {"field": "binned_mpg_end"},
    "y": {"aggregate": "count", "type": "quantitative"}
  }
}
Additional fields are added to the data object
When defining bin in a transform, it will create two new fields for each object: binned_mpg and binned_mpg_end. These indicate the boundaries of the bin that that object fits into. For example, the object
{
   "Name":"chevrolet chevelle malibu",
   "Miles_per_Gallon":18,
   "Cylinders":8,
   "Displacement":307,
   "Horsepower":130,
   "Weight_in_lbs":3504,
   "Acceleration":12,
   "Year":"1970-01-01",
   "Origin":"USA"
}
becomes
{
   "Name":"chevrolet chevelle malibu",
   "Miles_per_Gallon":18,
   "Cylinders":8,
   "Displacement":307,
   "Horsepower":130,
   "Weight_in_lbs":3504,
   "Acceleration":12,
   "Year":"1970-01-01",
   "Origin":"USA",
   "binned_mpg": 15,
   "binned_mpg_end": 20
}
Yet another way of creating a histogram is to work with two transforms: one to bin the data, and one to count the number of elements in the bin. This basically takes the output of the binning transform (i.e. the new binned_mpg field from above) and calculates the count on that. This way, the encoding is simpler to understand and we don’t have to do magic incantations within the definition of x and y.
{
  "$schema": "https://vega.github.io/schema/vega-lite/v4.json",
  "data": {
    "url": "https://raw.githubusercontent.com/vega/vega/master/docs/data/cars.json"
  },
  "transform": [
    {"bin": true, "field": "Miles_per_Gallon", "as": "binned_mpg"},
    {
      "aggregate": [{
         "op": "count",
         "field": "binned_mpg",
         "as": "count_mpg"
      }],
      "groupby": ["binned_mpg"]
    }
  ],
  "mark": "bar",
  "encoding": {
    "x": {"field": "binned_mpg","type": "quantitative"},
    "y": {"field": "count_mpg", "type": "quantitative"}
  }
}
Exercise - Create a plot showing the mean acceleration per bin of miles per gallon.