You can also take more control of which plots are put side by side, by using concat, hconcat or vconcat. This pragma can contain a list of objects with mark and encoding pairs:
{
  "data": ...,
  "hconcat": [
    {
      "mark": ...,
      "encoding: ...
    },
    {
      "mark": ...,
      "encoding: ...
    },
    {
      "mark": ...,
      "encoding: ...
    }
  ]
}
For example:
{
  "$schema": "https://vega.github.io/schema/vega-lite/v4.json",
  "title": "Side-by-side plots",
  "data": {
    "url": "https://raw.githubusercontent.com/vega/vega/master/docs/data/cars.json"
  },
  "transform": [
    { "calculate": "year(datum.Year)", "as": "yearonly" }

  ],
  "concat": [
    {
      "mark": "circle",
      "encoding": {
        "x": {"field": "Acceleration", "type": "quantitative"},
        "y": {"field": "Miles_per_Gallon", "type": "quantitative"},
        "color": {"field": "yearonly", "type": "ordinal"}
      }
    },
    {
      "mark": "circle",
      "encoding": {
        "x": {"field": "Horsepower", "type": "quantitative"},
        "y": {"field": "Miles_per_Gallon", "type": "quantitative"},
        "color": {"field": "yearonly", "type": "ordinal"}
      }
    }
  ]
}
Do not forget to put each mark - encoding pair within curly brackets! The above specification should give you the following image:
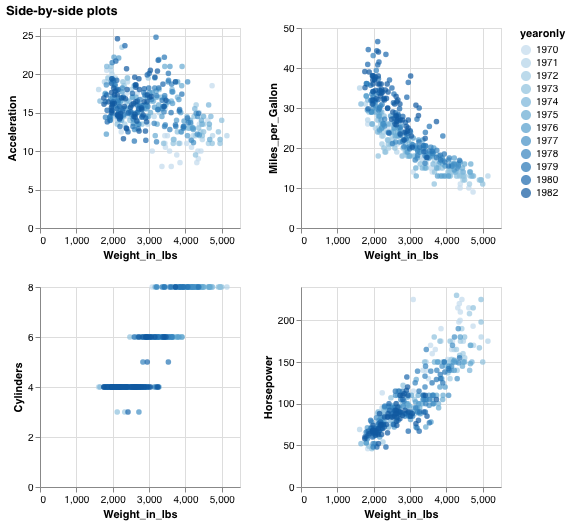
Exercise - Recreate the plot below (i.e. including the fact that it has 2 columns and 2 rows!). Tip: check the documentation for concat.