Based on what we’ve seen up until now, we can already create plots of acceleration versus miles per gallon with year as colour to get a feeling of how things change over time. Another option, is to have a single plot per year.
Exercise - Create a scatterplot of acceleration versus miles per gallon, with year defining the colour.
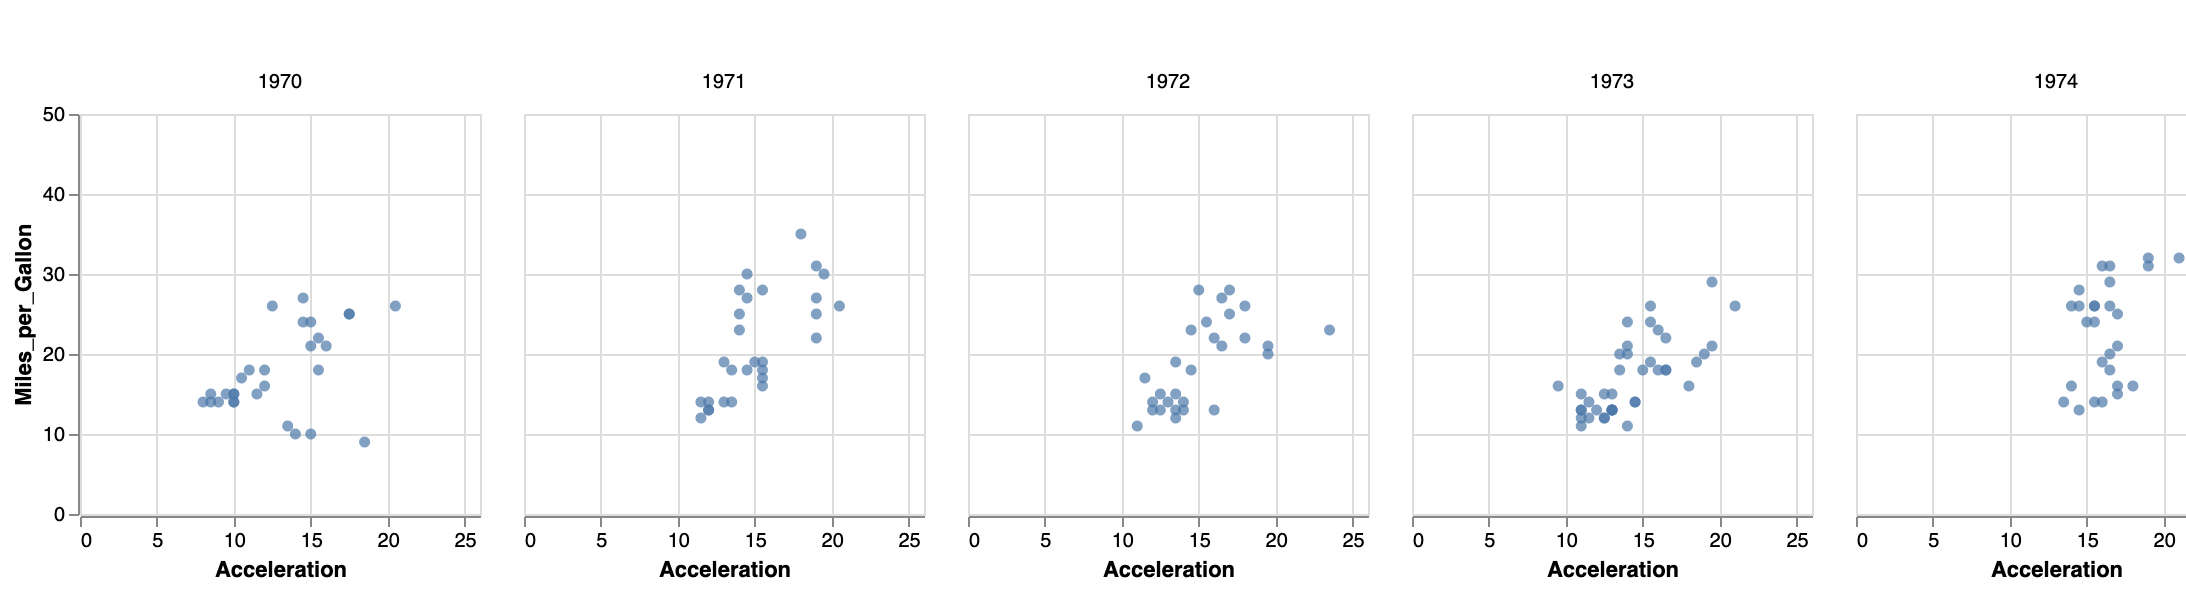
We can make a small-multiples plot with acceleration versus mpg, with a separate plot per year - called facetting by year (see https://vega.github.io/vega-lite/docs/facet.html for the documentation).
Just like with colour and shape described above, these facets can be defined in different places. The easiest will be "column": {"field": "yearonly", "type": "ordinal"} in the encoding section as below.
{
  "$schema": "https://vega.github.io/schema/vega-lite/v4.json",
  "data": {
    "url": "https://raw.githubusercontent.com/vega/vega/master/docs/data/cars.json"
  },
  "transform": [
    { "calculate": "year(datum.Year)", "as": "yearonly" }

  ],
  "mark": "circle",
  "encoding": {
    "x": {"field": "Acceleration", "type": "quantitative"},
    "y": {"field": "Miles_per_Gallon", "type": "quantitative"},
    "column": {"field": "yearonly", "type": "ordinal"}
  }
}
This will give you the following image:
Alternatively, you can define the facet at a higher level. According to the documentation, “to create a faceted view, define how the data should be faceted in facet and how each facet should be displayed in the spec.” This specification is a bit different than what we did before, as we have to wrap the mark and encoding within a separate spec section:
{
  "$schema": ...,
  "data": ...,
  "transform": [
    ...
  ],
  "facet": ...,
  "spec": {
    "mark": ...,
    "encoding": {
      ...
    }
  }
}
For example:
{
  "$schema": "https://vega.github.io/schema/vega-lite/v4.json",
  "data": {
    "url": "https://raw.githubusercontent.com/vega/vega/master/docs/data/cars.json"
  },
  "transform": [
    { "calculate": "year(datum.Year)", "as": "yearonly" }
  ],
  "facet": {"column": {"field": "yearonly", "type": "nominal"}},
  "spec": {
    "mark": "circle",
    "encoding": {
      "x": {"field": "Acceleration", "type": "quantitative"},
      "y": {"field": "Miles_per_Gallon", "type": "quantitative"}
    }
  }
}