The easiest - but still very useful - interaction you can create for a plot is to show a tooltip on hover. This is straightforward: you just add the tooltip key in the encoding section with an array of the fields that you want to have included in that tooltip:
{
  "title": "Showing a tooltip on hover",
  "data": {
    "url": "https://raw.githubusercontent.com/vega/vega/master/docs/data/cars.json"
  },
  "mark": "point",
  "encoding": {
    "x": {"field": "Acceleration", "type": "quantitative"},
    "y": {"field": "Miles_per_Gallon", "type": "quantitative"},
    "color": {"field": "Origin", "type": "nominal"},
    "tooltip": [
      {"field": "Acceleration", "type": "quantitative"},
      {"field": "Year", "type": "nominal"}
    ]
  }
}
This will get you the following behaviour (interactive):
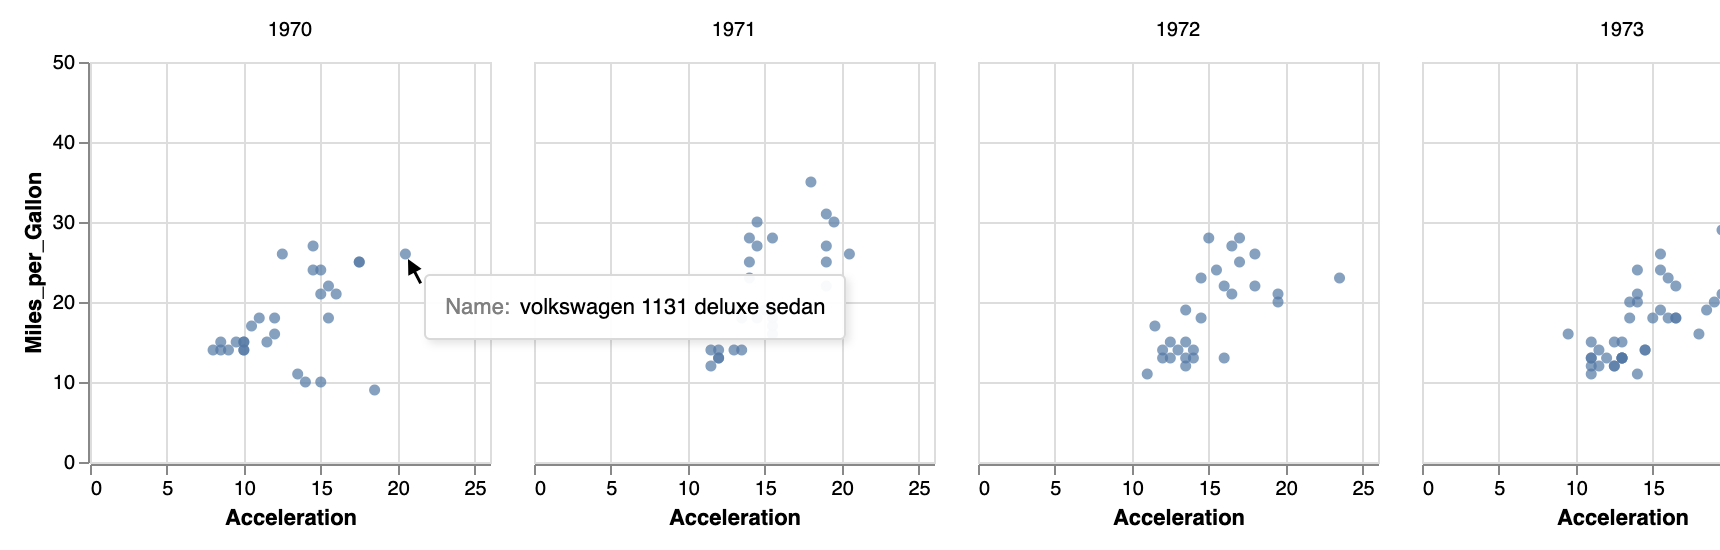
Exercise - Adapt the facetted plot you created before to include a tooltip showing the name of the car, like in the next plot.